Книга: Embedded Linux development using Eclipse
Performance Profiler (Formerly ProfileScope)
Performance Profiler (Formerly ProfileScope)
This is a dynamic performance profiler that shows where a program is spending its time. An agent on the target periodically takes a “snapshot” of the currently executing process and its call stack. These snapshots are saved in a buffer and periodically uploaded to the Profiler GUI on the host.
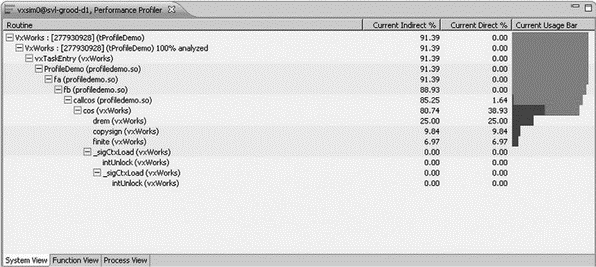
The Profiler graphically reports the percentage of CPU time spent in any function (Figure 9.22). This view organizes the information in a call stack format. Current Direct % is the time spent in the function itself. Current Indirect % is the time spent in the function and all functions that it calls. Click on a function name in the Performance Profiler, and an editor opens at that function.

Figure 9.22: Performance Profiler.
Похожие страницы
- Memory Analyzer (Formerly MemScope)
- Data Monitor (Formerly StethoScope)
- Configuring Apache for Peak Performance
- CHAPTER 31 Performance Tuning
- Real-Time Performance Measurement Tools
- 1.5.4. Performance
- Improving performance and fault tolerance with RAID
- 4.7.3 Performance
- Performance Graph Details and esxtop
- Chapter 11 Monitoring Virtual Infrastructure Performance
- 8.2 Avoiding performance problems
- Performance Graphs


