Книга: Embedded Linux development using Eclipse
9.4.3 On-Chip Debugging
9.4.3 On-Chip Debugging
The objective of the OCD version of Workbench is to provide tools that help in the early stages of a project, such as bringing up a new board. At this point there’s no operating system, so OCD supports a stand-alone application environment where the executable image is expected to be self-contained. We also can’t expect the hardware itself to be working, so usually a hardware debugging device such as a JTAG probe or an in-circuit emulator (ICE) is called for.
Accordingly, Workbench OCD provides Remote System connections for two classes of hardware debugging products, Wind River ICE and Wind River Probe. Both products use either JTAG or BDM ports to connect to a target board. Probe connects to the host through USB, while ICE connects via Ethernet and an RS-232 port. Both devices support typical debugging features, such as:
• Execution control: download, start, stop
• Breakpoints
• Examine and modify memory and registers
• Flash programming
• Hardware Diagnostics
Additionally, the ICE class products offer profile analysis and trace capabilities.
Wind River provides a number of sample programs to illustrate various features of Workbench. Under File?New is an Example… menu item that can be used to create various sample projects. One class of examples is that of stand-alone projects that require no OS support (Figure 9.17). The C Demonstration program is a good starting point.
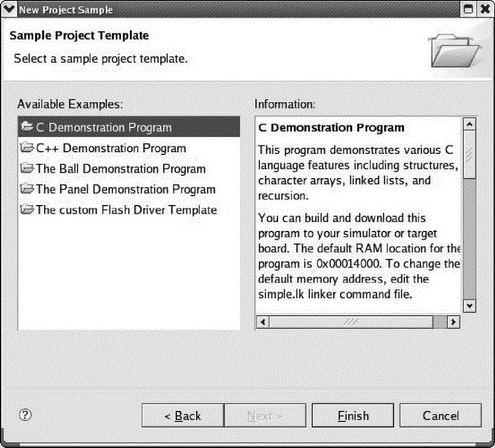
Figure 9.17: Sample project selection.
In place of an actual ICE or Probe device, the evaluation version provides an instruction set simulator for a PowerPC MPC8260 processor. You establish a connection to the instruction set simulator in the same way you would to any other type of remote system (see Figure 9.18).
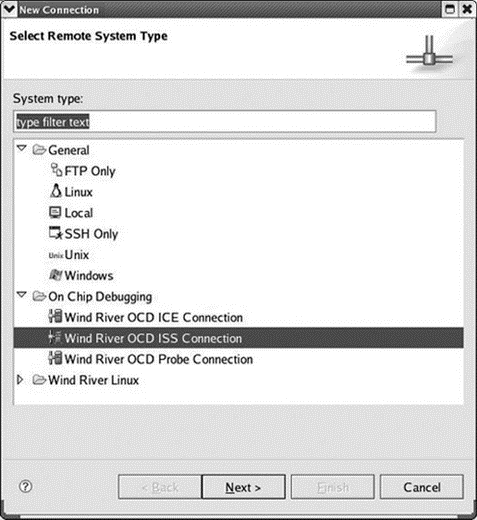
Figure 9.18: Remote system connection.
Next, you create a launch configuration for the project that uses the ISS connection. The dialog for setting up an OCD launch configuration is somewhat different from the launch configurations we’ve seen before (Figure 9.19). Perhaps not surprisingly, the dialog deals with a lot of hardware issues. The Download tab lets you specify the files that will be downloaded to the target.
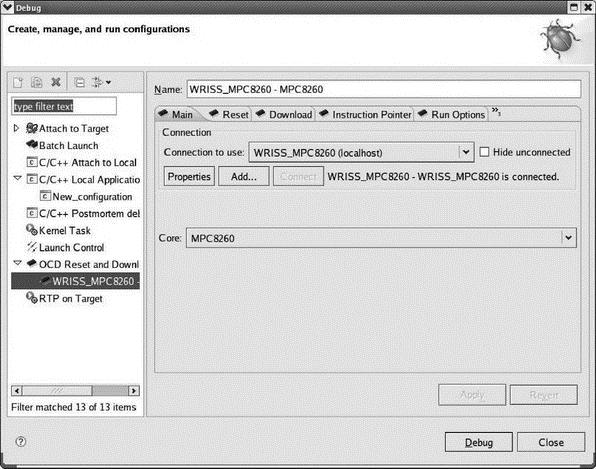
Figure 9.19: OCD launch configuration.
Clicking Debug brings up the Device Debug perspective, which is similar to the standard Debug perspective, with some additional views (Figure 9.20). A System Context view appears in the editor window. This is a mixed C and assembly language listing of the code being executed. The Debug Symbol Browser shows all of the symbols in the project and supports operations such as going directly to the symbol’s declaration and setting a breakpoint at the symbol.
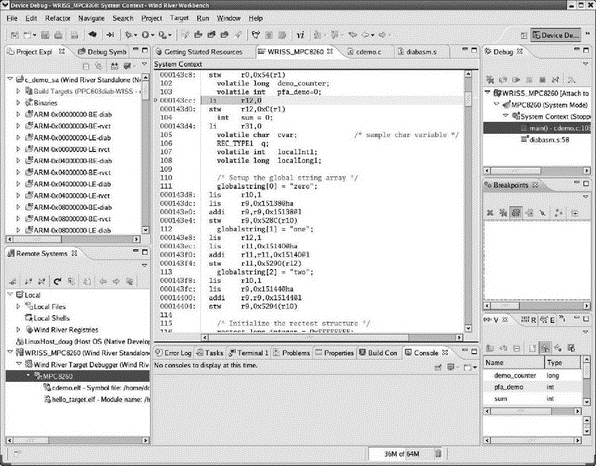
Figure 9.20: Device Debug perspective.
From this point on, debugging is essentially the same as we’ve seen earlier. Workbench OCD supports some additional views that are only meaningful if the debugging tool provides the necessary data. These include:
• Flash Programmer
• Hardware Diagnostics
• OCD Statistical Code Profiling
• Trace
- 3.1. Stand-alone Processors
- 3.2. Integrated Processors: Systems on Chip
- 3.1.4. Companion Chipsets
- 7.2.1. DRAM Controller
- 10.3. MTD Partitions
- 10.3.4. Flash Chip Drivers
- 10.3.5. Board-Specific Initialization
- 3.5 On-Chip Debugging
- 9.4.1 Getting the Evaluation
- Chapter 12. Debugging your scripts
- Debugging, a necessity
- Bash debugging tips
