Книга: Embedded Linux development using Eclipse
Code Coverage Analyzer (Formerly CoverageScope)
Code Coverage Analyzer (Formerly CoverageScope)
This tool reports how much of the code in a system has been executed, or more importantly, which code hasn’t been executed. Unlike the other tools, Code Coverage requires that the code be recompiled with the appropriate instrumentation added. You select which files to instrument and the level of coverage analysis. The four types of coverage are:
• Function: Verifies that the function was called.
• Block: Did this statement or block of statements get executed?
• Decision: Have both the true and false branches of a Boolean expression used in a branching statement such as if() or while() been executed?
• Condition: Did every subexpression in a Boolean expression evaluate to both true and false? Example:
if (a && b || BuggyFunction())
How to be sure that BuggyFunction() was executed?
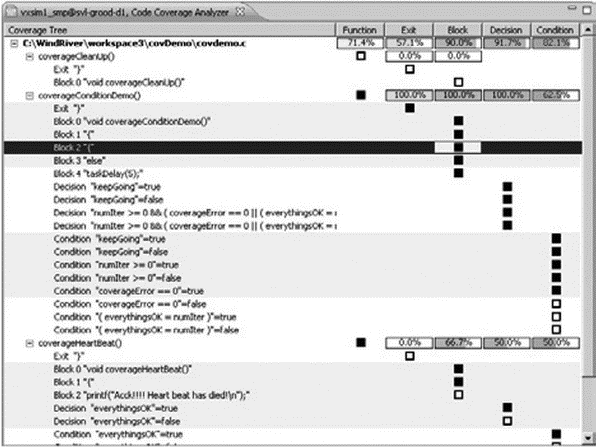
The high-level output from Code Coverage is shown in Figure 9.24. Double-click on any function name and the source code shows up in an editor with the uncovered code highlighted.

Figure 9.24: Code Coverage Analyzer.
- Memory Analyzer (Formerly MemScope)
- Системные переменные ROWS_AFFECTED, GDSCODE, SQLCODE, TRANSACTIONJD, CONNECTIONJD
- Appendix J. Example scripts code-base
- Test Driver Code
- Regulating Code to Regulate Better
- Part Two - Regulation By Code
- 6. Лекция: Обработка текстов. Регулярные выражения. Unicode.
- Переопределение System.Object.GetHashCode()
- Using the autoconf Utility to Configure Code
- 14.3.2. Debugging Optimized Kernel Code
- Using a USB Protocol Analyzer
- Where to Get the Code


