Книга: Embedded Linux development using Eclipse
Data Monitor (Formerly StethoScope)
Data Monitor (Formerly StethoScope)
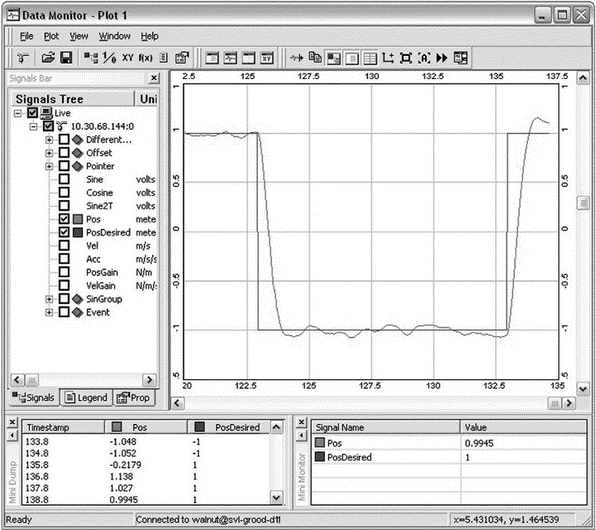
The Data Monitor uses an oscilloscope metaphor to monitor program variables in real time and display the results graphically (Figure 9.23). Like the Performance Profiler, an agent on the target periodically samples the variables being monitored and stores the values in a local buffer. A low priority process then sends this buffer to the host for display. The performance hit is claimed to be fairly minor.

Figure 9.23: Data Monitor.
The sampling interval is configurable. Variables can be added or removed from the monitor list while the application runs. Variable values can also be modified at run time. Collected data can be stored to a file on the host, formatted for post processing by other applications, such as MatLab or Excel.
As described thus far, the Data Monitor is asynchronous with respect to any running applications. In some situations, it may be more meaningful to collect data synchronously. The Data Monitor target agent can be configured to collect data in response to calls from the application, thus making data collection synchronous with respect to the application.
- Performance Profiler (Formerly ProfileScope)
- Информация заголовочной страницы (Database header)
- Database dialect
- DATABASE CACHE SIZE
- Data sending and control session
- SCTP DATA chunk
- Data Binding Using the GridView Control
- Interbase DataPump
- GetDataBack
- Работа с DataRow
- 16.8. Реализация отношений в Core Data
- CHAPTER 12 System-Monitoring Tools


