Книга: Mastering VMware® Infrastructure3
esxtop
esxtop
Virtual machine performance can also be monitored using a command-line tool named esxtop. A great reason to use esxtop is the immediate feedback it gives you after you've made an adjustment to a virtual machine. The esxtop command is not new, but it does include some new features and capabilities. All four resource types (CPU, Disk, Memory, and Network) can be monitored for a particular ESX host.
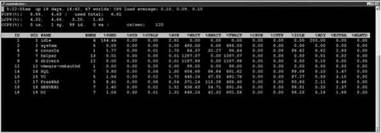
With the new and improved esxtop we can look at two counters, CPU Used and Ready Time. We can also see these counters in the virtual machine graphs, but with this tool they are calculated as percentages. If virtual machines are running on the same host, we can easily compare the virtual machines as they are identifiable by name, unlike in previous versions. If they run on two different hosts, then a direct comparison is harder without opening two different ssh client sessions. Even then, the virtual machines are not in direct competition, so an apples-to-apples comparison may be difficult. In Figure 11.31, esxtop is monitoring the CPU usage of several virtual machines running on the same host, which is the default view. The amount of processor time being used, %USED, and the amount of time not getting scheduled, %RDY, are listed for each virtual machine. If we increase a virtual machine's reservation or shares, we'll see a corresponding change in these two fields, as %USED will increase its percentage and %RDY will decrease. If you look at one of the other screens for a different resource, just press C to bring it back to the CPU resource screen.

Figure 11.31 The command-line tool esxtop showing CPU statistics for several virtual machines and VMkernel processes.
ESXTOP
Remember, esxtop only shows a single ESX host. In a virtual infrastructure where VMotion, DRS, and HA have been deployed, virtual machines may move around often. Making reservation or share changes while the virtual machine is currently on one ESX Server may not have the desired consequences if the virtual machine is moved to another server and the mix of virtual machines on that server represents different performance loads.
To monitor memory usage, press M. This gives you real-time statistics about the ESX Server's memory usage in the top portion and the virtual machines' memory usage in the lower section, as shown in Figure 11.32.
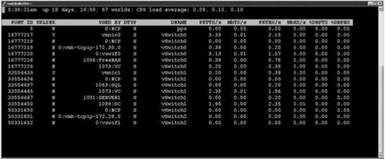
To monitor network statistics about the vmnics, individual virtual machines, or VMkernel ports used for iSCSI, VMotion, and NFS, press N. The columns showing network usage, as shown in Figure 11.33, include packets transmitted and received and megabytes transmitted and received for each vmnic or port. Also shown in the DNAME column are the vSwitches and, to the left, what is plugged into them, including virtual machines, VMkernel, and service console ports. If a particular virtual machine is monopolizing the vSwitch, you can look at the amount of network traffic on a specific switch and the individual ports to see which virtual machine is the culprit.

Figure 11.32 Using esxtop to display memory usage on a single ESX host.

Figure 11.33 Using esxtop to display network statistics on an ESX Server.
To monitor disk I/O statistics about each of the SCSI controllers, press D. The output of disk I/O monitoring with esxtop is shown in Figure 11.34. The columns on the far left are most often used to determine disk loads. Those columns show loads based on reads and writes per second and megabytes read and written per second. Another important column is the NVMS, which shows how many virtual machines are sharing the same controller. If an application in one of the virtual machines is sluggish, it's easy to see using this column how many other virtual machines it may be competing with.

Figure 11.34 Using esxtop to display controller I/O statistics.
Another great feature of esxtop is the ability to capture performance data for a short period of time and then play back that data. Using the command vm-support, you can set an interval and duration for the capture.
Perform these steps to capture data to be played back on esxtop:
1. While logged in as root or after switching to root user, change your working directory to /tmp by issuing the command cd /tmp.
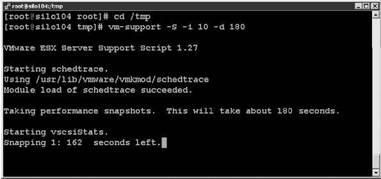
2. Issue the command vm-support -S -i 10 -d 180. This creates an esxtop snapshot, capturing data every ten seconds, for the duration of 180 seconds, as shown in Figure 11.35.

Figure 11.35 Capturing data for esxtop.
3. The resulting file is a tarball and is gzipped. It must be extracted with the command tar -xzf esx*. tgz. This will create a vm-support directory that will be called in the next command.
4. Run esxtop-R /vm-support* to replay the data for analysis, as shown in Figure 11.36.

Figure 11.36 Replaying the data in esxtop.


