Книга: Mastering VMware® Infrastructure3
Creating Host and Virtual Machine Alarms
Разделы на этой странице:
Creating Host and Virtual Machine Alarms
The Performance tab provides a robust mechanism for creating graphs that depict the actual resource consumption over time for a given host or virtual machine. The graphs provide historical information and can be used for trend analysis. VirtualCenter provides many objects and counters to analyze the performance of a single virtual machine or host for a selected interval. The Virtual Machines tab provides information on a virtual machine's CPU and memory consumption, as shown in Figure 11.1.
In addition to the graphs and high-level information tabs, the administrator can create alarms for virtual machines or hosts based on predefined triggers provided with VirtualCenter. These alarms can monitor resource consumption or the state of the virtual machine and alert the administrator when certain conditions have been met, such as high resource usage or even low resource usage. These alarms can then provide an action that informs the administrator of the condition by e-mail or SNMP trap. An action can also automatically run a script or provide other means to correct the problem the virtual machine or host may be experiencing.
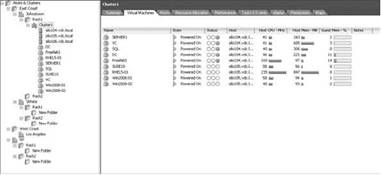
Figure 11.1 The Virtual Machines tab of a Cluster object offers a quick look at virtual machine CPU and memory usage.
The creation of alarms to alert the administrator of a specific condition is not new in VirtualCenter. But the addition of new triggers, conditions, and actions gives the alarms more usefulness than in previous editions. As you can see in Figure 11.2, the alarms that come with VirtualCenter are defined at the topmost object, Hosts & Clusters.

Figure 11.2 Default alarms for hosts and virtual machines are created at the Hosts & Clusters inventory object.
The default alarms are generic in nature and are set to provide identification of host or virtual machine CPU and memory consumption that exceeds 75% and 90% thresholds. These alarms will also identify a change in the state of the host or virtual machine. In most cases, virtual machines won't require alarms with thresholds with such high values as they are usually low-utilization applications. And while the host alarms might get to those levels in times of a server outage, a good virtualization architecture will prevent such high utilization on a consistent basis.
Since the default alarms are likely too generic for your administrative needs, creating your own alarms is often necessary. An administrator may want to watch a specific virtual machine to see if it drops below a certain threshold. A service-level agreement (SLA) for this virtual machine may specify that consumption not drop below 20% CPU utilization to meet its obligations. Also, let's say that this virtual machine normally runs around 30% CPU utilization when the application is running hot. The administrator could set a virtual machine alarm with a trigger for CPU and a condition of Is Below to 25% to send the administrator an e-mail warning that the virtual machine has dropped below 25%. The alarm can also be set to e-mail the administrator if the virtual machine drops below 20%, and, in this case, the e-mail would alert the administrator so corrective action could be taken.
Figure 11.2 shows the Alarms dialog box used to configure the triggers, thresholds, and actions of an alarm. The dialog box includes two buttons near the top-left portion: Triggered Alarms and Definitions. Any alarm(s) currently triggered display for this inventory object when you click the Triggered Alarms button. Clicking the Definitions button switches the view to show any alarms that have been created or inherited for this inventory object. Speaking of inheritance, if you create an alarm on a datacenter, folder, cluster, or resource pool, the alarm will be inherited by all child objects below it. In some cases, this is what you want, but in other cases, the alarm may be specific to a particular virtual machine or host. In such cases the alarm will be created directly on that object and therefore not inherited. Figure 11.3 shows the configuration of a trigger and thresholds for an alarm.
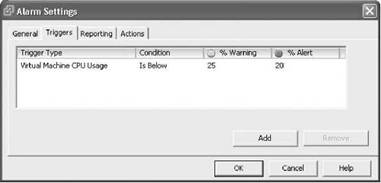
Figure 11.3 A sample alarm showing a virtual machine CPU alarm definition with an Is Below condition, a % Warning of 25%, and % Alert of 20%.
Perform the following steps to create an alarm:
1. Click to select a particular object in the inventory, such as a virtual machine, host, resource pool, cluster, folder, or datacenter. Then select the Alarms tab, and right-click in the blank area of the Definitions pane, as shown in Figure 11.4, and choose New Alarm.
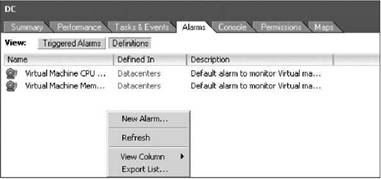
Figure 11.4 The starting point for a new alarm.
2. In the Alarm Settings dialog box, specify whether this will be a host-based alarm or a virtual machine-based alarm. In either case, most of the setup will be the same.
3. On the General tab, select the alarm type and then choose a trigger priority of either Red or Green, as shown in Figure 11.5. The red and green alarm notifications are simply visual cues of changes. They are arbitrary but can represent a good change (green) or a bad change (red).
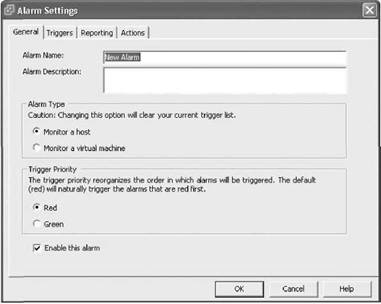
Figure 11.5 On the General tab, you specify an alarm name, alarm type, and trigger priority.
Red Light, Yellow Light, Green Light
Most alarms are of the red variety when it comes to the Trigger Priority setting. But occasionally the administrator wants to know when a virtual machine hits a warning level or when a virtual machine returns to a green condition. The yellow warnings allow administrators to catch potential problems before they reach unacceptable levels that result in performance declines. For instance, a virtual machine that kicks off a batch job during the day goes red when the job starts, and when the batch is done the virtual machine goes back to green and alerts the administrator that the job has completed.
4. If this alarm goes immediately into service, select the Enable This Alarm option.
5. Click the Triggers tab.
6. A trigger, show in Figure 11.6, provides a way to specify a particular condition or threshold to monitor. There are five possible triggers for an alarm:
? Host or Virtual Machine CPU Usage
? Host or Virtual Machine Memory Usage
? Host or Virtual Machine Network Usage
? Host or Virtual Machine Disk Usage
? Host or Virtual Machine State
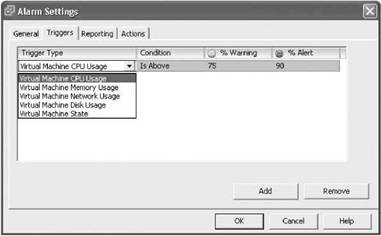
Figure 11.6 Selecting a trigger for either a virtual machine or a host.
Once you choose a trigger type, you must specify a condition. There are only two conditions — Is Above and Is Below — for the Usage alarms. For the State alarms, Is Equal To or Not Equal To are your only choices. If the trigger type was the state of a host or virtual machine, then setting the condition to Is Equal To could provide an alert if the virtual machine was powered off, as shown in Figure 11.7.
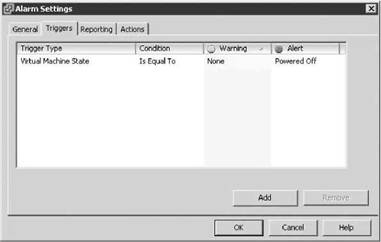
Figure 11.7 Setting a trigger type of Virtual Machine State with a condition of Is Equal To, a warning of None, and an alert of Powered Off.
Real World Scenario
Caution: Counter Values Will Vary!
The Is Above condition is selected most often for identifying a virtual machine or host that is over a certain threshold. The administrator decides what that threshold should be and what is considered abnormal behavior (or at least interesting enough behavior to be monitored). For the most part, monitoring across ESX Server hosts will be consistent. For example, administrators will define a threshold that is worthy of being notified about and configure an alarm across all hosts for monitoring that counter. However, when looking at the more granular virtual machine monitoring, it might be more difficult to come up with a single baseline that works for all virtual machines. Specifically, think about enterprise applications that must perform well for extended periods of time. For these types of scenarios, administrators would want custom alarms for earlier notifications of performance problems. This way, as opposed to reacting to a problem, administrators can be proactive in trying to prevent problems from occurring.
For virtual machines with similar functions like domain controllers and DNS servers, it might be possible to establish baselines and thresholds covering all such infrastructure servers. In the end, the beauty of the monitoring tools lies in the flexibility to be as customized and as granular as needed for each virtual infrastructure.
8. Next, provide the warning and alert thresholds required to monitor for specific usage conditions. The values for these two variables vary and depend on the type and resource tendencies of the application, SLA, or other abnormal or interesting behavior, as shown in Figure 11.8.
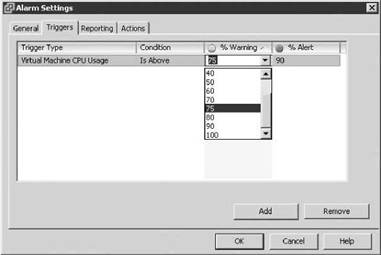
Figure 11.8 Setting warning and alert thresholds for an alarm.
9. After you've set these four variables on the Triggers tab, it's on to the Reporting tab, as shown in Figure 11.9.
I Know Already!
The Reporting tab is new to this version of VirtualCenter. This tab gives the administrator greater flexibility in defining how often an alarm sends an e-mail or a SNMP trap or some other action. The Tolerance section provides a way to set the percentage of change before the second alarm is sent out. If the original alarm was set to send an e-mail after an initial trigger threshold of 50%, and if the Tolerance field was set to 10%, then the second e-mail would be sent if the threshold had changed to 55%. This allows the administrator to monitor escalating events or to prevent receiving another e-mail for the same persistent but unvarying condition.
The Frequency section allows the administrator to define how much time should elapse before another e-mail or SNMP trap is sent out. An example of where this may be helpful is if a virtual machine's CPU shoots up to over 75% and the administrator knows this is normal for this virtual machine given the nature of what it was designed to do. If the condition lasted longer than what was considered normal for that virtual machine, another e-mail will be sent after so many seconds have elapsed (which could turn into minutes if a very high value is used).
Both of these Reporting features can be used simultaneously or individually to give the administrator greater precision.
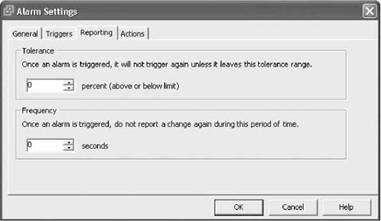
Figure 11.9 The Reporting tab, which contains Tolerance and Frequency settings.
10. Click the Actions tab.
11. The reason for having the alarm is to monitor defined conditions and alert administrators, perhaps via e-mail as shown in Figure 11.10, so they can take any necessary administrative action. Administrators can also configure alarms to be proactive in trying to solve any problems by allowing the alarm to respond one of the predefined ways or by running a script that provides an infinite variety of actions. The precise action depends on whether the object being monitored is a host or a virtual machine. If it is a host, the possible actions are:
? Send a notification e-mail
? Send a notification trap
? Run a script
If the object being monitored is a virtual machine, then the possible actions are:
? Send a notification e-mail
? Send a notification trap
? Run a script
? Power on a virtual machine
? Power off a virtual machine
? Suspend a virtual machine
? Reset a virtual machine
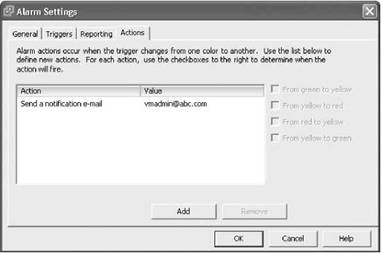
Figure 11.10 An example of sending an e-mail if the alarm is triggered.
Alarm Scripts
If the action to be taken involves running a script, understand that the script runs on the VirtualCenter server and may consume significant resources. On the Actions tab, under the Action column, choose Run a Script. You must then supply a value. The syntax for calling the script is c:fixmyvm.vbs {targetName} {alarmName} and must be passed as one string. The targetName is the host or virtual machine name; the alarmName is the name of the alarm.
Each action is tied to a change in condition or conditions that are listed to the right of the actions as checkboxes:
? From Green to Yellow
? From Yellow to Red
? From Red to Yellow
? From Yellow to Green
12. Once you've configured all the tabs, click OK.
13. To have VirtualCenter send an e-mail for a triggered host or virtual machine alarm, provide the recipient's e-mail address (see Figure 11.11). VirtualCenter must also be configured with an SMTP server to send any e-mails. Normally, the setup of the SMTP server and the SNMP management receiver(s) would be established ahead of time. To configure the SMTP server, from the main VI Client screen choose the Administration menu, then VirtualCenter Management Server Configuration. Click on Mail in the list on the left, and then supply the SMTP server and the Sender Account so that when you receive an e-mail, you know it came from the VirtualCenter server, such as [email protected]. To have VirtualCenter send an SNMP trap, follow the same procedure but click on SNMP in the VirtualCenter Management Server Configuration dialog box on the left and specify one to four management receivers to monitor for traps.
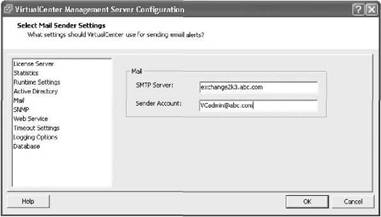
Figure 11.11 Setting up the SMTP server to send e-mails on behalf of the alarms on the VirtualCenter server.
Once the four tabs have been configured, click OK and your alarm will be added to the list for that object. You can have more than one alarm for an object. As with any new alarm, testing its functionality is crucial to make sure you get the desired results. If the alarm needs editing, right-click the alarm from the list and choose Edit Settings to make the necessary modifications. Or, if the alarm is no longer needed, right-click the alarm and choose Remove to delete the alarm.
- Chapter 11 Monitoring Virtual Infrastructure Performance
- Разработка приложений баз данных InterBase на Borland Delphi
- Open Source Insight and Discussion
- Introduction to Microprocessors and Microcontrollers
- Chapter 6. Traversing of tables and chains
- Chapter 7. The state machine
- Chapter 8. Saving and restoring large rule-sets
- Chapter 11. Iptables targets and jumps
- Chapter 5 Installing and Configuring VirtualCenter 2.0
- Chapter 16. Commercial products based on Linux, iptables and netfilter
- Appendix A. Detailed explanations of special commands
- Appendix B. Common problems and questions
