Книга: Mastering VMware® Infrastructure3
Monitoring Host and Virtual Machine Memory Usage
Разделы на этой странице:
Monitoring Host and Virtual Machine Memory Usage
Monitoring memory usage, whether on a host or a virtual machine, can be challenging. The monitoring itself is not difficult; it's the availability of the physical resource that can be a challenge. Of the four resources, memory can be oversubscribed without much effort. Depending on the physical form-factor chosen to host ESX Server 3.x, running out of physical RAM is easy to do. Although the blade form-factor creates a very dense consolidation effort, the blades sometimes are constrained by the amount of physical memory and network adapters that can be installed. But even with other regular form-factors, having enough memory installed comes down to how much the physical server can accommodate and your budget.
Many virtual machines do not need a great deal of memory to do their jobs effectively. If an assessment has been done prior to consolidation efforts, the amount of memory being used by any one server can be identified up front. Once the server has been converted, editing the virtual machines settings to a value more in tune with its actual usage can be achieved. This allows you to consolidate more servers onto fewer hosts. But what if the server is new to the organization and does not have a track record? What amount of memory should the virtual machine be configured with? Should you use the application's vendor recommendation? Should you start low and increase later? Or start high and reduce later?
Pre-ESX Server Baseline: Scenario 1
If the server was first deployed as a physical server with a given role, there might be some record of usage before being converted into an ESX Server. Many times physical servers are purchased with more memory than what the application needs or uses. This may be done due to hardware vendor inducements during purchasing, or standardization on a specific hardware model and build within an organization. Or it could be a case of memory inflation, where a customer goes by the application vendor's recommendations. These recommendations can be inflated to make sure the hardware will not be an issue when it comes to performance.
VMware provides a service, Capacity Planner, that assesses the physical server's resource usage prior to conversion. Even with other products or tools, assessing a physical server's memory usage during peak intervals is relatively easy. Once the physical server has been converted, the virtual machine can be configured with a new limit that reflects actual usage and not a guess. Some servers respond well in this scenario. Others start well enough, but over time increase their memory usage. This is where using VirtualCenter's graphs can be very helpful. Since the charts can be modified to reflect long-term trends and usage, it is easy to identify a virtual machine that has an increased need for more memory or, in some cases, the reverse.
New Servers: Scenario 2
The second scenario is harder to predict. A new server with no track record leaves much to the discretion of the virtual infrastructure manager. Using the application vendor's recommendation may be the best start for the virtual machine. Once the virtual machine has been live for some period of time, VirtualCenter's graphs can help determine what the actual usage is over a particular time frame and make adjustments accordingly.
Perform these steps to create a real-time graph for a virtual machine's memory usage:
1. Connect to the VirtualCenter server or an individual ESX Server host with the VI Client.
2. In the inventory tree, click on a virtual machine. This shows you the Summary tab. Click the Performance tab, as shown in Figure 11.44.
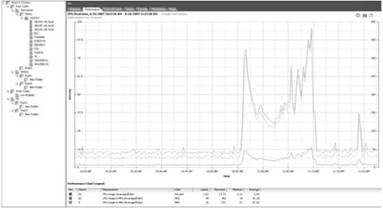
Figure 11.44 The Performance tab can be altered from the default CPU monitoring to support custom charting needs.
3. Click the Change Chart Options link.
4. Under Chart Options, click on the Network bull's-eye or the + sign. This view allows you to select the objects and counters that provide the most relevant information, as shown in Figure 11.45. Real-time memory graphs have a lot of counters, but usually only a few are used for any one graph. In this case, we'll use Memory Usage (Average/Absolute), Memory Overhead (Average/Absolute), and Memory Consumed (Average/Granted) to get a clear picture of memory utilization as it relates to host consumption and relative to what the virtual machine was configured with.
5. In Figure 11.46, the graph shows virtual machine memory consumption. Many times, you may like to know how much overhead is associated with a virtual machine or how much memory the virtual machine is using compared to what it was configured with. Choose the chart type and click OK.
When monitoring a host server's memory usage, overall utilization is important to watch. As explained earlier in this chapter, creating alarms to alert you when certain conditions arise is one way of monitoring your hosts. In addition to alarms, occasionally looking at host graphs as they pertain to memory usage will give you some perspective as to what is normal on your servers and what is abnormal or weird. There are even more counters to choose from when customizing your graphs, but, again, you will usually select just a few for any one graph.
Perform these steps to create a real-time graph for a host's memory usage:
1. Connect to the VirtualCenter server or an individual ESX Server host with the VI Client.
2. In the inventory tree, click on a virtual machine. This shows you the Summary tab. Click the Performance tab, as shown in Figure 11.47.
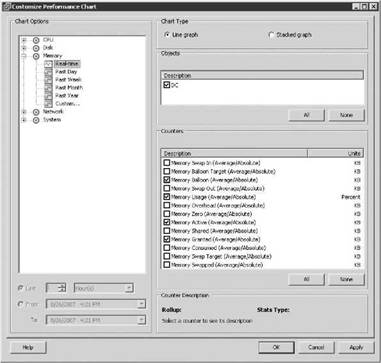
Figure 11.45 Selecting objects and counters to monitor memory usage for a virtual machine.
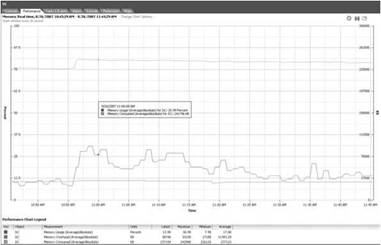
Figure 11.46 Select those relevant objects and counters to provide the information needed.
3. Click the Change Chart Options link.
4. Under Chart Options, click on the Network bull's-eye or the + sign. This view allows you to select the objects and counters that provide the most relevant information, as shown in Figure 11.48. Real-time memory graphs have a lot of counters, but usually only a few are used for any one graph. In this case, we'll use Memory Usage (Average/Absolute), Memory Overhead (Average/Absolute), Memory Active (Average/Absolute), Memory Consumed (Average/Granted), and Memory Used by VMkernel to get a clear picture of memory utilization as it relates to the host.
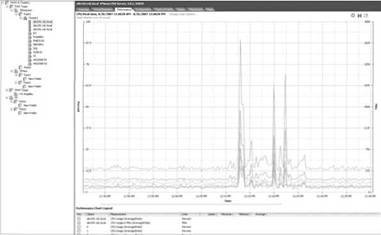
Figure 11.47 The Performance tab for a host defaults to monitoring information about CPU usage on the entire host.
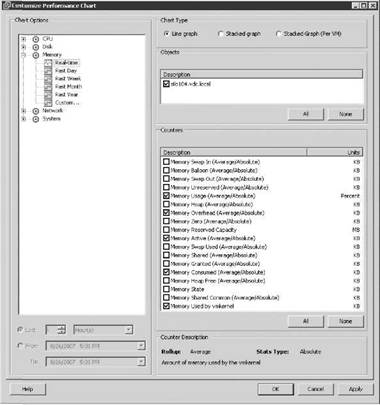
Figure 11.48 Setting up the memory options for a host's memory graph.
Counters, Counters, and More Counters
As with virtual machines, there are a plethora of counters that can be utilized with a host for monitoring memory usage. Which ones you select will depend on what you're looking for. Straight memory usage monitoring is common, but don't forget that there are other counters that could be helpful, such as Ballooning, Unreserved, VMkernel Swap, and Shared, just to name a few. The ability to assemble the appropriate counters for finding the right information comes with experience and depends on what is being monitored.
5. The graph, shown in Figure 11.49, shows host overhead and virtual machine memory consumption. Many times, you may like to know how much overhead is associated with a virtual machine or how much memory the virtual machine is using compared to what it was configured with. Click OK.
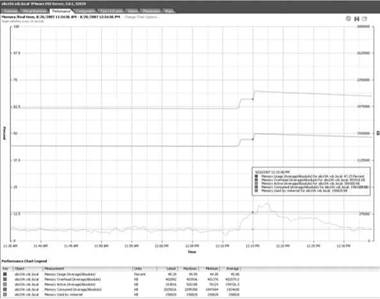
Figure 11.49 Select those relevant objects and counters to provide the information needed. If necessary, choose the chart type.
- Chapter 11 Monitoring Virtual Infrastructure Performance
- Разработка приложений баз данных InterBase на Borland Delphi
- EVENT MEMORY SIZE
- Open Source Insight and Discussion
- Introduction to Microprocessors and Microcontrollers
- Chapter 6. Traversing of tables and chains
- Chapter 7. The state machine
- Chapter 8. Saving and restoring large rule-sets
- Chapter 11. Iptables targets and jumps
- Chapter 5 Installing and Configuring VirtualCenter 2.0
- Chapter 16. Commercial products based on Linux, iptables and netfilter
- Appendix A. Detailed explanations of special commands


