Книга: Mastering VMware® Infrastructure3
Monitoring Host and Virtual Machine Disk Usage
Monitoring Host and Virtual Machine Disk Usage
Monitoring a host's controller or virtual machine's virtual disk usage is similar in scope to monitoring network usage. This resource, which represents a controller or the storing of a virtual machine's virtual disk on a type of supported storage, isn't restricted by CPU or memory mechanisms like reservations, limits, or shares. The only way to restrict a virtual machine's disk activity is to assign shares on the individual virtual machine, which in turn may have to compete with other virtual machines running from the same storage volume. VirtualCenter's graphs come to our aid again in showing actual usage for both ESX hosts and virtual machines.
Using the graph in Figure 11.62, we can monitor a host's overall controller activity. This view doesn't allow us to see why the activity is occurring or which virtual machine is generating the activity, but if we are looking for a particular host with suspicious disk I/O activity, this is a starting point.
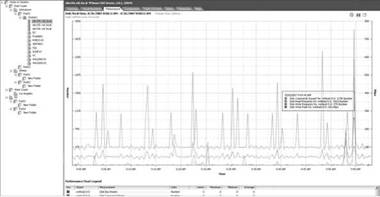
Figure 11.62 VirtualCenter graphs can report on host or virtual machine performance.
Perform these steps to create a host graph showing disk controller utilization:
1. Connect to the VirtualCenter server or an individual ESX Server host with the VI Client.
2. In the inventory tree, click on an ESX host. This shows you the Summary tab in the Details section on the right. Select the Performance tab.
3. Click the Change Chart Options link.
4. Under Chart Options, click on the Disk bull's-eye or the + sign, shown in Figure 11.63. Chart Options allows you to choose the interval of time to monitor. For this example, we chose Real-time, which shows Disk activity for the last hour.
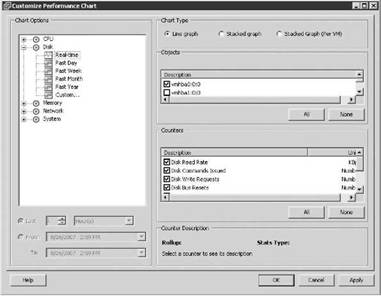
Figure 11.63 Creating a real-time graph for monitoring host controller utilization.
5. Selecting an object or objects, in this case a controller, and a counter or counters lets you monitor for activity that is interesting or necessary to meet service levels. In the custom chart selection shown in Figure 11.64, selecting the objects vmhba0:0:0 and silo104.vdc.local, then selecting counters Disk Read Rate, Disk Write Rate, and Disk Usage (Average/Rate) will give an overall view of the activity for controller 0.
6. In reviewing the graph in Figure 11.65, we discover that the host isn't generating much Read activity, except for one spike around 9:55 AM. Write activity isn't much either and the Disk Usage counter is showing a low pattern of activity, which aggregates the data for both Read and Write.
Host disk I/O is in a controller context, but we can switch to a Stacked Graph view (see Figure 11.66) that allows us to see each virtual machine's activity stacked on top of one another to see their aggregate usage as well.
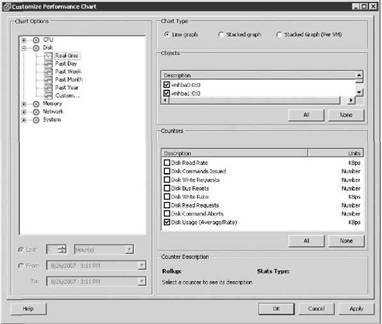
Figure 11.64 Setting up the objects and counters for a real-time graph for a specific controller.
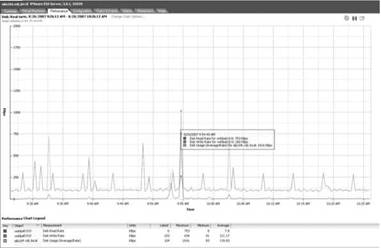
Figure 11.65 Controller usage graph for vmhba0:0:0.
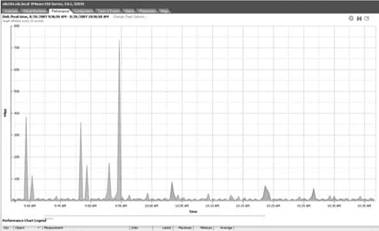
Figure 11.66 Switching to Stacked Graph per-virtual-machine view lets us make quick comparisons or find a virtual machine that is monopolizing its volume. This particular graph shows very little disk activity for either virtual machine.
Stacked Views
A stacked view is very helpful in identifying whether one particular virtual machine is monopolizing a volume. Whichever virtual machine has the tallest stack in the comparison may be degrading the performance of other virtual machines' virtual disks.
Now let's switch to the virtual machine view. Looking at individual virtual machines for insight into their disk utilization can lead to some useful conclusions. File and print virtual machines, or any server that provides print queues or database services, will generate some disk-related I/O that needs to be monitored. In some cases, if the virtual machine is generating too much I/O, it may degrade the performance of other virtual machines running out of the same volume. Let's take a look at a virtual machine's graph.
Perform these steps to create a virtual machine graph showing real-time disk controller utilization:
1. Connect to the VirtualCenter server or an individual ESX Server host with the VI Client.
2. In the inventory tree, click on an ESX host. This shows you the Summary tab in the Details section on the right. Select the Performance tab.
3. Click the Change Chart Options link.
4. Under Chart Options, click on the Disk bull's-eye or the + sign, as shown in Figure 11.67.
5. Using the graph objects vmhba0:0:0 and the virtual machine name, plus the counters of Disk Read, Disk Write, and Disk Usage (Average/Rate) counters, we can produce an informative picture of this virtual machine's disk I/O behavior. This virtual machine is busy at work generating reads and writes for its application. Does the graph show enough I/O to meet a service-level agreement or does this virtual machine need some help? The graphs allow administrators to make informed decisions, usually working with the application owners, so that any adjustments to improve I/O will lead to happy virtual machine owners.
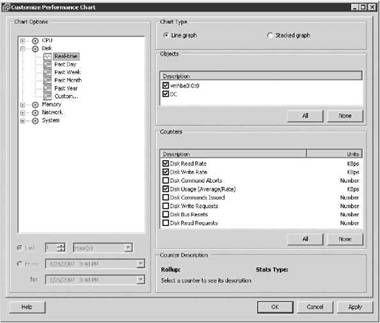
Figure 11.67 Setting up the graph for a single virtual machine.
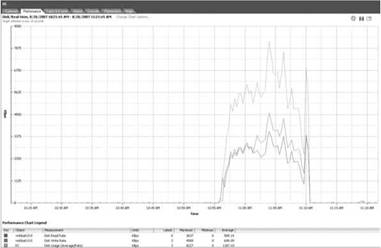
Figure 11.68 A virtual machine disk usage graph can help you decide if you need to make adjustments.
The graph in Figure 11.68 shows real disk I/O that may indicate that a virtual machine is performing its duties well. In addition, by looking at longer intervals of time to gain a historical perspective it may show that the virtual machine has become busier or fallen off its regular output and is therefore not meeting expectations. If the amount of I/O is just slightly impaired, then adjusting the virtual machine's shares maybe a way to prioritize its disk I/O ahead of other virtual machines sharing the volume. The administrator may be forced to move the virtual machine's virtual disk(s) to another volume or LUN if share adjustments don't achieve the required results.
- Chapter 11 Monitoring Virtual Infrastructure Performance
- Разработка приложений баз данных InterBase на Borland Delphi
- Open Source Insight and Discussion
- Introduction to Microprocessors and Microcontrollers
- Chapter 6. Traversing of tables and chains
- Chapter 7. The state machine
- Chapter 8. Saving and restoring large rule-sets
- Chapter 11. Iptables targets and jumps
- Chapter 5 Installing and Configuring VirtualCenter 2.0
- Chapter 16. Commercial products based on Linux, iptables and netfilter
- Appendix A. Detailed explanations of special commands
- Appendix B. Common problems and questions
