Книга: Embedded Linux development using Eclipse
9.3.4 Memory Analysis Tools
9.3.4 Memory Analysis Tools
DevRocket includes two memory analysis tools: a memory leak detector and a usage analyzer. The leak detector is based on mpatrol, an open source library that wraps malloc() and free() functions, and the C++ new() operator, with instrumentation that logs each call to these functions. mpatrol is a dynamically-linked shared library, so there’s no change to the application.
DevRocket wraps the text-based mpatrol library and utilities with a graphical Eclipse front end to make it easier to work with. To run a program with memory leak detection, you create a Memory Leak Detection run configuration from the MontaVista menu. This is much like any other run or debug launch configuration, with the addition of a tab for configuring mpatrol (Figure 9.12). The defaults seem to be just fine.
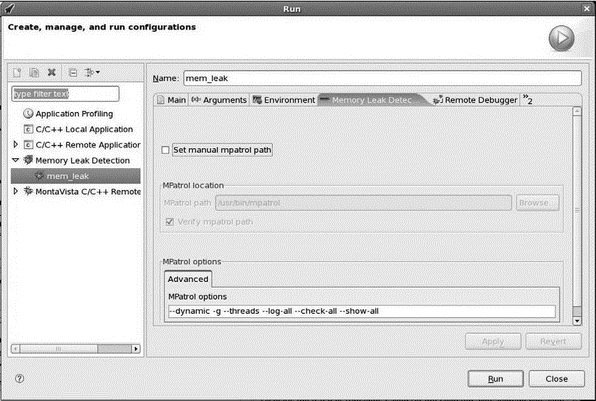
Figure 9.12: Memory leak detection launch configuration.
When you click Run, DevRocket invokes mpatrol to run the program and then brings up the Memory Leak Detection perspective, with views that display the contents of the mpatrol logs. Figure 9.13 shows a Call Graph in the Memory Leak Detection view.
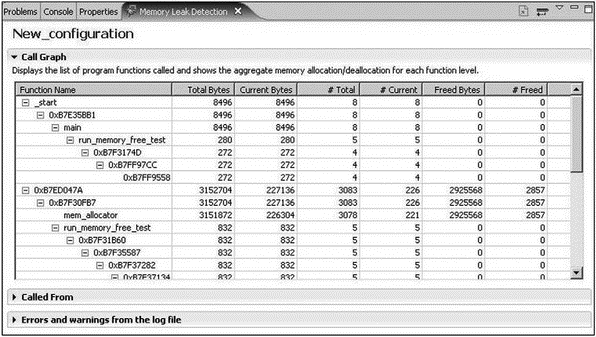
Figure 9.13: Memory Leak Detection view.
The memory analysis tool is intended to help you find memory usage problems quickly and accurately by providing a graphical depiction of memory usage across the entire system. Memory analysis starts with a high-level view showing relative memory usage for the whole system. From there you can drill down into kernel and applicationspecific memory usage. Drilling down even further, you can view a memory map for each application.
From the menu bar, select MontaVista?Memory Usage Analyzer. This brings up the Memory Usage Analyzer view, shown in Figure 9.14. From here you can click on Applications or Kernel to get more detail. Figure 9.15 shows memory usage by user space applications. The kernel usage graph shows memory allocated by vmalloc(), allocated as slabs, and memory used by page tables.
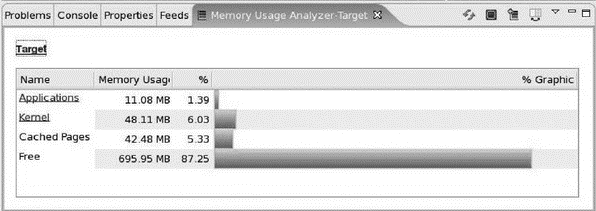
Figure 9.14: Memory Usage Analyzer view, system level.
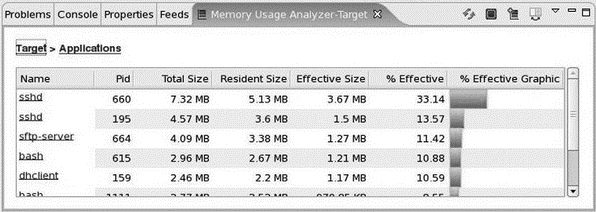
Figure 9.15: Memory Usage Analyzer view, applications.
The information for the Memory Usage Analyzer comes from /proc files. There are a number of virtual files in the /proc directory and in the subdirectories for each process that provide information on memory usage. The Memory Usage Analyzer simply collates this information in a convenient, easy-to-understand format.
- Graphical Development Tools
- 9.4.4 Analysis Tools
- EVENT MEMORY SIZE
- System tools used for debugging
- Other debugging tools
- CHAPTER 12 System-Monitoring Tools
- 12.2.1 Port-Mapped vs. Memory-Mapped I
- Group Management Tools
- User Management Tools
- Controlling Services at Boot with Administrative Tools
- Displaying Free and Used Memory with free
- Graphical Process and System Management Tools
