Книга: Fedora™ Unleashed, 2008 edition
Graphical Process and System Management Tools
Graphical Process and System Management Tools
The GNOME and KDE desktop environments offer a rich set of network and system- monitoring tools. Graphical interface elements, such as menus and buttons, and graphical output, including metering and real-time load charts, make these tools easy to use. These clients, which require an active X session and (in some cases) root permission, are included with Fedora.
If you view the graphical tools locally while they are being run on a server, you must have X properly installed and configured on your local machine. Although some tools can be used to remotely monitor systems or locally mounted remote file systems, you have to properly configure pertinent X11 environment variables, such as $DISPLAY, to use the software or use the ssh client's -X option when connecting to the remote host.
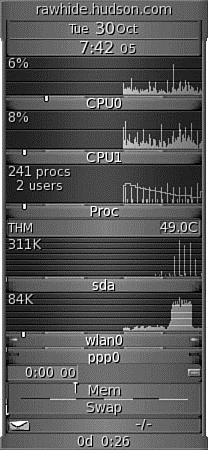
Fedora no longer includes the xosview client, which provided load, CPU, memory and swap use, disk I/O use and activity, page-swapping information, network activity, I/O activity, I/O rates, serial port status, and if APM is enabled, the battery level (such as for a laptop). However, a great replacement is GKrellM, which provides a much neater interface and a host of additional plug-ins. You have to use this command to retrieve GKrellM:
# yum install gkrellm
After you have installed GKrellM, you can find it under Applications, System Tools. Figure 12.2 shows GKrellM.

FIGURE 12.2 GKrellM allows you to monitor most system processes on Fedora.
Graphical system- and process-monitoring tools that come with Fedora include the following:
? vncviewer — AT&T's open source remote session manager (part of the Xvnc package), which can be used to view and run a remote desktop session locally. This software (discussed in more detail in Chapter 15, "Remote Access with SSH") requires an active, background, X session on the remote computer.
? gnome-nettool — A GNOME-developed tool that enables system administrators to carry out a wide range of diagnostics on network interfaces, including port scanning and route tracing.
? ethereal — This graphical network protocol analyzer can be used to save or display packet data in real time and has intelligent filtering to recognize data signatures or patterns from a variety of hardware and data captures from third-party data capture programs, including compressed files. Some protocols include AppleTalk, Andrew File System (AFS), AOL's Instant Messenger, various Cisco protocols, and many more.
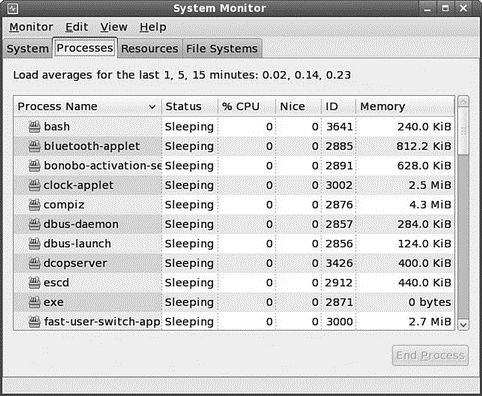
? gnome-system-monitor — This tool is a simple process monitor offering three views: a list view, a moving graph, and a storage status overview. To access it, choose Applications, System Tools, and select the System Monitor entry (see Figure 12.3).

FIGURE 12.3 The Process Listing view of the System Monitor.
From the Process Listing view (chosen via the Processes tab in the upper-left portion of the window), select a process and click More Info at the bottom left of the screen to display details on that process at the bottom of the display. You can select from three views to filter the display, available in the drop-down View list: All Processes, My Processes (those you alone own), or Active Processes (all processes that are active).
Choose Hidden Processes under the Edit command accessible from the top of the display to show any hidden processes (those that the kernel does not enable the normal monitoring tools to see). Select any process and kill it with End Process.
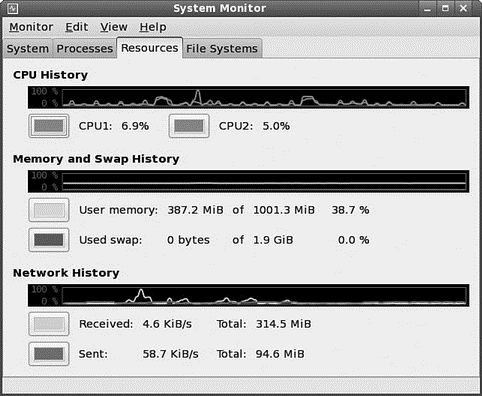
You can change the nice value of the processes by selecting Edit, Change Priority. The View selection from the menu bar also provides a memory map. In the Resources tab, you can view a moving graph representing CPU and memory use (see Figure 12.4).

FIGURE 12.4 The Graph view of the System Monitor. It shows CPU use, memory/swap use, and disk use. To get this view, select the Resources tab.
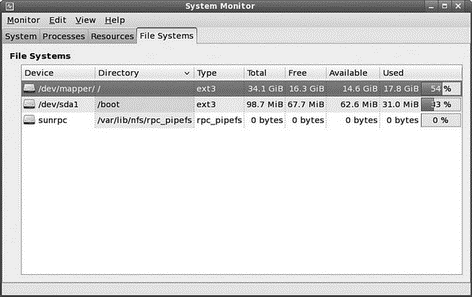
Finally, you can see the status of your file system and storage devices by clicking the File Systems tab shown in Figure 12.5.

FIGURE 12.5 Keep a close eye on your free disk space.
- CHAPTER 12 System-Monitoring Tools
- User Management Tools
- KDE Process- and System-Monitoring Tools
- 9.4.4 Analysis Tools
- Разработка приложений баз данных InterBase на Borland Delphi
- Open Source Insight and Discussion
- Introduction to Microprocessors and Microcontrollers
- Chapter 6. Traversing of tables and chains
- Chapter 8. Saving and restoring large rule-sets
- Chapter 11. Iptables targets and jumps
- Chapter 5 Installing and Configuring VirtualCenter 2.0
- Chapter 15. Graphical User Interfaces for Iptables


