Книга: Microsoft Windows Embedded CE 6.0 Exam Preparation Kit
Readlog Tool
Readlog Tool
In addition to the graphical Remote Kernel Tracker application, you can process CELog data files by using the Readlog tool, located in the %_WINCEROOT%PublicCommonOakBini386 folder. Readlog is a command-line tool to process and display information not exposed in Remote Kernel Tracker, such as debug messages and boot events. It is often useful to analyze system activities in Remote Kernel Tracker first and then focus on an identified process or thread with the Readlog tool. The raw data that the CeLogFlush tool writes into the .clg file is ordered by zones to facilitate locating and extracting specific information. You can also filter the data and extend filtering capabilities based on extension DLLs to process custom data captured through the custom events collector.
One of the most useful Readlog scenarios is to replace thread start addresses (the functions passed to the CreateThread call) in CeLog data files with the names of the actual thread functions to facilitate system analysis in Remote Kernel Tracker. To accomplish this task, you must start Readlog with the -fixthreads parameter (readlog -fixthreads). Readlog looks up the symbol .map files in the release directory to identify the thread functions based on the start addresses and generates new logs with the corresponding references.
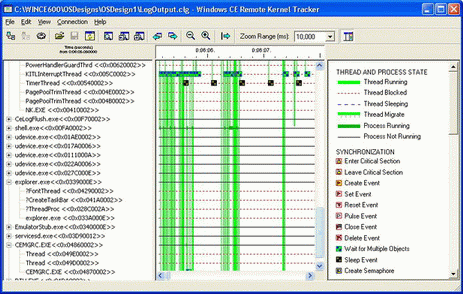
Figure 4-6 shows CeLog data in Remote Kernel Tracker, captured through the CeLog event-tracking system, flushed to a .clg file with the CeLogFlush tool, and prepared for a more user-friendly display of the information by using the Readlog application with the -fixthreads parameter.

Figure 4-6 A CeLog data file prepared with readlog -fixthreads and opened in Remote Kernel Tracker
NOTE
Improving reference naming matching
The CeLog event-tracking system can take advantage of the kernel profiler to look up thread function names based on start addresses when capturing CreateThread events, if you explicitly enable the kernel profiler and add profiling symbols to the run-time image by rebuilding the image with the IMGPROFILER environment variable set. However, CeLog can only look up the profiling symbols built into the run-time image. Symbols of applications developed based on a Software Development Kit (SDK) are generally unavailable to the CeLog event-tracking system.
- CeLogFlush Tool
- System tools used for debugging
- Other debugging tools
- CHAPTER 12 System-Monitoring Tools
- Group Management Tools
- User Management Tools
- Controlling Services at Boot with Administrative Tools
- Graphical Process and System Management Tools
- KDE Process- and System-Monitoring Tools
- tar: The Most Basic Backup Tool
- The KDE Archiving Tools (KDE ark and kdat)
- Using Network Configuration Tools


