Книга: Microsoft Windows Embedded CE 6.0 Exam Preparation Kit
Debugging and Target Device Control
Debugging and Target Device Control
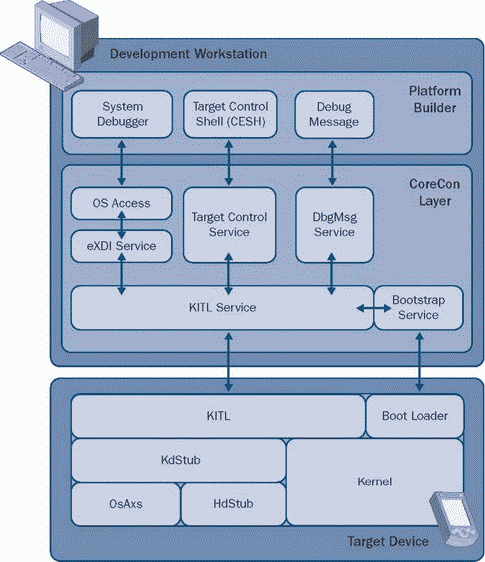
The primary tool to debug and control a Windows Embedded CE target device is by using Platform Builder on the development workstation, as illustrated in Figure 4-1. The Platform Builder integrated development environment (IDE) includes a variety of tools for this purpose, such as a system debugger, CE target control shell (CESH), and debug message (DbgMsg) feature, that you can use to step through code after reaching a breakpoint or to display information on memory, variables, and processes. Moreover, the Platform Builder IDE includes a collection of remote tools, such as Heap Walker, Process Viewer, and Kernel Tracker, to analyze the state of the target device at run time.

Figure 4-1 CE debugging and target control architecture
In order to communicate with the target device, Platform Builder relies on the Core Connectivity (CoreCon) infrastructure and debugging components deployed on the target device as part of the run-time image. The CoreCon infrastructure provides OS Access (OsAxS), target control, and DbgMsg services to Platform Builder on one side, and interfaces with the target device through the Kernel Independent Transport Layer (KITL) and the bootstrap service on the other side. On the target device itself, the debugging and target control architecture relies on KITL and the boot loader for communication purposes. If the run-time image includes debugging components, such as the kernel debugger stub (KdStub), hardware debugger stub (HdStub), and the OsAxS library, you can use Platform Builder to obtain kernel run-time information and perform just-in-time (JIT) debugging. Platform Builder also supports hardware- assisted debugging through Extended Debugging Interface (eXDI), so that you can debug target device routines prior to loading the kernel.
- Target Control Commands
- Debugging a Target Device
- Разработка приложений баз данных InterBase на Borland Delphi
- Open Source Insight and Discussion
- Introduction to Microprocessors and Microcontrollers
- Chapter 6. Traversing of tables and chains
- Chapter 8. Saving and restoring large rule-sets
- Chapter 11. Iptables targets and jumps
- Chapter 12. Debugging your scripts
- Chapter 5 Installing and Configuring VirtualCenter 2.0
- Chapter 16. Commercial products based on Linux, iptables and netfilter
- Appendix A. Detailed explanations of special commands


