Книга: Advanced PIC Microcontroller Projects in C
5.3.4 Using the mikroICD In-Circuit Debugger
Разделы на этой странице:
5.3.4 Using the mikroICD In-Circuit Debugger
This section discusses how to use the mikroICD in-circuit debugger (also called the PICFlash 2 programmer) to debug the program developed in Example 5.1. First of all, we have to build the hardware and then connect the in-circuit debugger device. In this example, the hardware is built on a breadboard, and a PICFlash 2 mikroICD in-circuit debugger is used to debug the system. Note that pins RB6 and RB7 are used by the mikroICD and are not available for I/O while mikroICD is active.
The Circuit Diagram
The project’s circuit diagram is shown in Figure 5.50. The mikroICD in-circuit debugger is connected to the development circuit using the following pins of the microcontroller:
• MCLR
• RB6
• RB7
• +5V
• GND
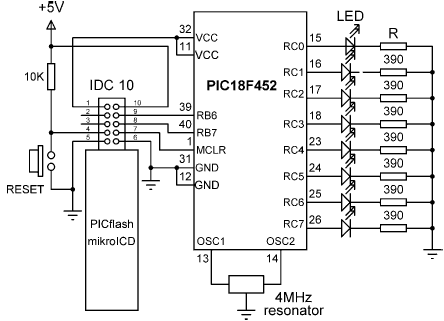
Figure 5.50: Circuit diagram of the project
The mikroICD has two modes of operation. In inactive mode all lines from the microcontroller used by the debugger device are connected to the development system. In active mode the MCLR, RB6, and RB7 pins are disconnected from the development system and used to program the microcontroller. After the programming, these lines are restored.
The mikroICD debugger device has a 10-way IDC connector and can be connected to the target system with a 10-way IDC header. Once the development is finished and the mikroICD debugger is removed, opposite pairs of the IDC header can be connected with jumpers. Figure 5.51 shows the system built on a breadboard.
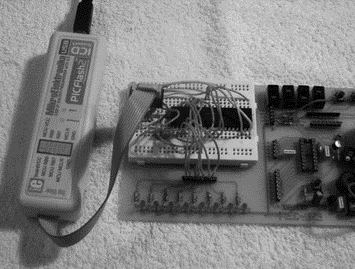
Figure 5.51: System built on a breadboard
Debugging
After building the hardware we are ready to program the microcontroller and test the system’s operation with the in-circuit debugger. The steps are as follows:
Step 1 Start the mikroC IDE, making sure the program developed in Example 5.1 is displayed in the Code Editor window.
Step 2 Click the Edit Project button (Figure 5.52) and set DEBUG_ON as shown in Figure 5.53.

Figure 5.52: Edit Project button
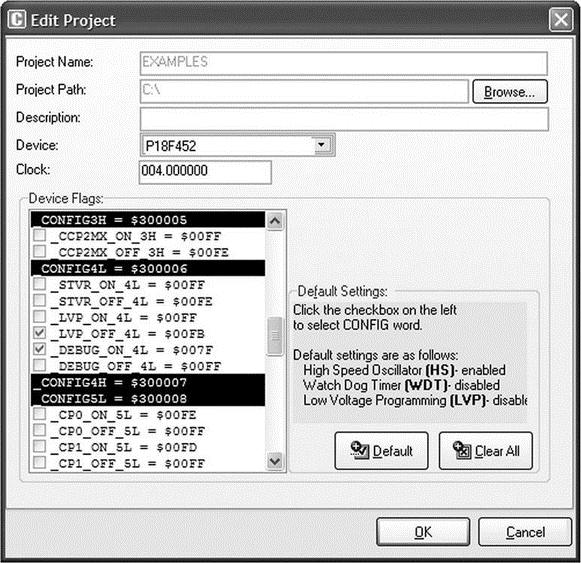
Figure 5.53: Set the DEBUG_ON
Step 3 Select ICD Debug in the Project Setup window as shown in Figure 5.54.
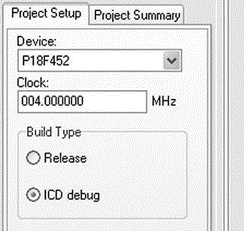
Figure 5.54: Select the ICD Debug
Step 4 Click the Build Project icon to compile the program with the debugger. After a successful compilation you should see the message Success (ICD Build) in the Message Window.
Step 5 Make sure the mikroICD debugger device is connected as in Figure 5.50, and select Tools?PicFlash Programmer from the drop-down menu to program the microcontroller.
Step 6 From the drop-down menu select Debugger?Select Debugger?mikroICD Debugger as shown in Figure 5.55.

Figure 5.55: Selecting the mikroICD debugger
Step 7 From the drop-down menu select Run?Start Debugger. The debugger form will pop up and select variables Sum, i, and PORTC as described in Example 5.2.
Step 8 Single-step through the program by pressing the F8 key. You should see the values of variables changing. At the end of the program, decimal value 55 will be sent to PORTC, and LEDs 0,1,2,4, and 5 should be turned ON, as shown in Figure 5.56, corresponding to this number.

Figure 5.56: Decimal number 55 shown in LEDs
Step 9 Stop the debugger.
In routines that contain delays, the Step Into [F7] and Step Over [F8] commands can take a long time. Run to Cursor [F4] and breakpoints should be used instead.
- 5.3 mikroC Integrated Development Environment (IDE)
- 4.4.4 The Dispatcher
- About the author
- Chapter 7. The state machine
- Appendix E. Other resources and links
- Caveats using NAT
- Example NAT machine in theory
- Using Double Quotes to Resolve Variables in Strings with Embedded Spaces
- The final stage of our NAT machine
- Compiling the user-land applications
- The conntrack entries
- Untracked connections and the raw table
