Книга: Advanced PIC Microcontroller Projects in C
5.3.3 Using the Simulator
Разделы на этой странице:
5.3.3 Using the Simulator
The program developed in Section 5.3.2 is simulated following the steps given here, using the simulator in software (release mode). That is, no hardware is used in this simulation.
Example 5.2
Describe the steps for simulating the program developed in Example 5.1. Display the values of various variables and PORTC during the simulation while single-stepping the program. What is the final value displayed on PORTC?
Solution 5.2
The steps are as follows:
Step 1 Start the mikroC IDE, making sure the program developed in Example 5.1 is displayed in the Code Editor window.
Step 2 From the drop-down menu select Debugger?Select Debugger?Software PIC Simulator, as shown in Figure 5.43.

Figure 5.43: Selecting the debugger
Step 3 From the drop-down menu select Run?Start Debugger. The debugger form shown in Figure 5.44 will appear.
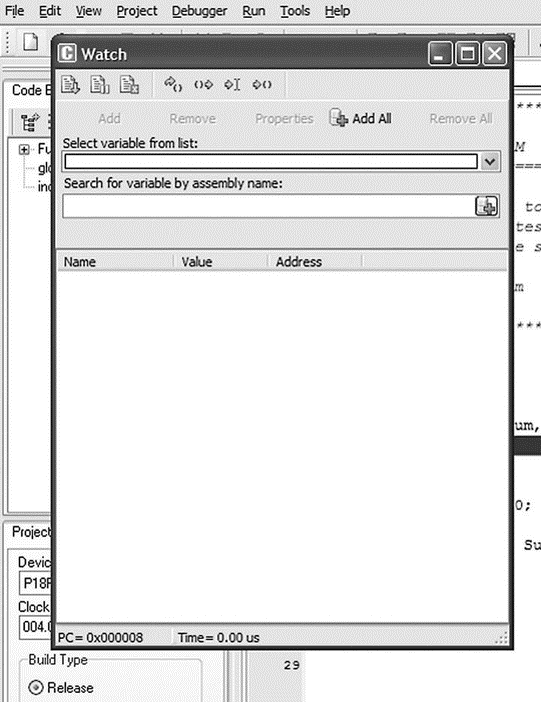
Figure 5.44: Starting the debugger
Step 4 Select the variables we want to see during the simulation. Assuming we want to display the values of variables Sum, i, and PORTC:
• Click on Select from variable list and then find and click on the variable name Sum
• Click Add to add this variable to the Watch list
• Repeat these steps for variable i and PORTC
The debugger window should now look like Figure 5.45.
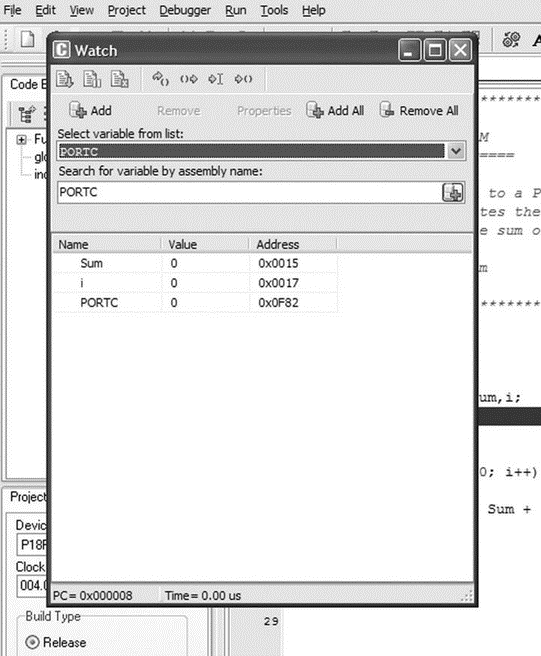
Figure 5.45: Selecting variables to be displayed
Step 5 We can now single-step the program and see the variables changing.
Press the F8 key on the keyboard. You should see a blue line to move down. This shows the line where the program is currently executing. Keep pressing F8 until you are inside the loop and you will see that variables Sum and i have become 1, as shown in Figure 5.46. Recently changed items appear in red. Double-clicking an item in the Watch window opens the Edit Value window, where you can change the value of a variable or register, or display the value in other bases such as decimal, hexadecimal, binary, or as a floating point or character.
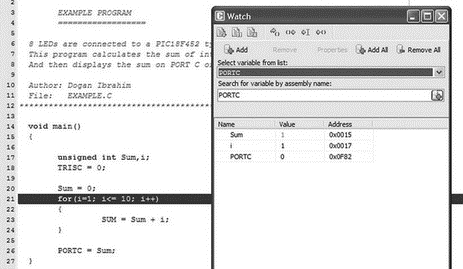
Figure 5.46: Single-stepping through the program
Step 6 Keep pressing F8 until the program comes out of the for loop and executes the line that sends data to PORTC. A this point, as shown in Figure 5.47, i = 11 and Sum = 55.
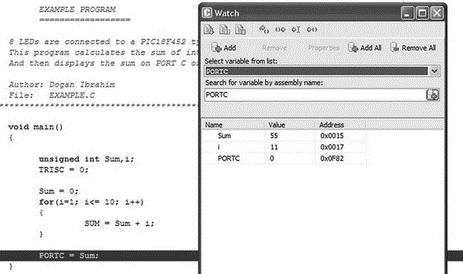
Figure 5.47: Single-stepping through the program
Step 7 Press F8 again to send the value of variable Sum to PORTC. As shown in Figure 5.48, in this case PORTC will have the decimal value 55, which is the sum of numbers from 1 to 10.
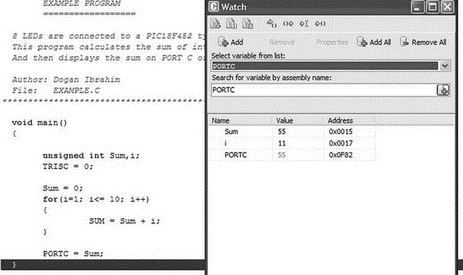
Figure 5.48: PORTC has the value 55
This is the end of the simulation. Select from drop-down menu Run?Stop Debugger.
In the above simulation example, we single-stepped through the program to the end and then we could see the final value of PORTC. The next example shows how to set breakpoints in the program and then execute up to a breakpoint.
Example 5.3
Describe the steps involved in simulating the program developed in Example 5.1. Set a breakpoint at the end of the program and run the debugger up to this breakpoint. Display the values of various variables and PORTC at this point. What is the final value displayed on PORTC?
Solution 5.3
The steps are as follows:
Step 1 Start the mikroC IDE, making sure the program developed in Example 5.1 is displayed in the Code Editor window.
Step 2 From the drop-down menu select Debugger?Select Debugger?Software PIC Simulator.
Step 3 From the drop-down menu select Run?Start Debugger.
Step 4 Select variables Sum, i, and PORTC from the Watch window as described in Example 5.2.
Step 5 To set a breakpoint at the end of the program, click the mouse at the last closing bracket of the program, which is at line 27, and press F5. As shown in Figure 5.49, you should see a red line at the breakpoint and a little marker in the left column of the Code Editor window.
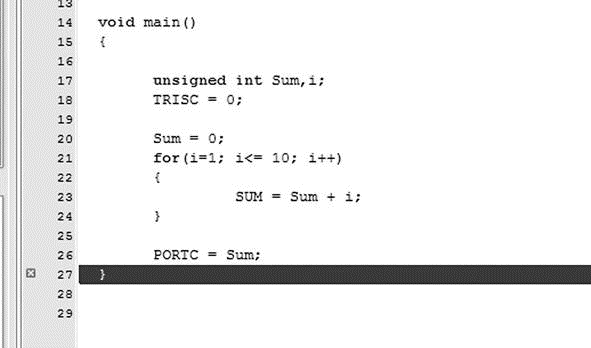
Figure 5.49: Setting a breakpoint at line 27
Step 6 Now, start the debugger, and press F6 key to run the program. The program will stop at the breakpoint, displaying variables as shown in Figure 5.48.
This is the end of the simulation. Select from drop-down menu Run?Stop Debugger.
To clear a breakpoint, move the cursor over the line where the breakpoint is and then press F5. To clear all breakpoints in a program, press the SHIFT+CTRL+F5 keys. To display the breakpoints in a program, press the SHIFT+F4 keys.
The following are some other useful debugger commands:
Step Into [F7] Executes the current instruction and then halts. If the instruction is a call to a routine, the program enters the routine and halts at the first instruction.
Step Over [F8] Executes the current instruction and then halts. If the instruction is a call to a routine, it skips it and halts at the first instruction following the call.
Step Out [CTRL+F8] Executes the current instruction and then halts. If the instruction is within a routine, it executes the instruction and halts at the first instruction following the call.
Run to Cursor [F4] Executes all instructions between the current instruction and the cursor position.
Jump to Interrupt [F2] Jumps to the interrupt service routine address (address 0x08 for PIC18 microcontrollers) and executes the procedure located at that address.
- 4.4.4 The Dispatcher
- About the author
- Chapter 7. The state machine
- Appendix E. Other resources and links
- Caveats using NAT
- Example NAT machine in theory
- Using Double Quotes to Resolve Variables in Strings with Embedded Spaces
- The final stage of our NAT machine
- Compiling the user-land applications
- The conntrack entries
- Untracked connections and the raw table
- Basics of the iptables command
