Книга: Embedded Linux development using Eclipse
4.6.1 The Debug View
4.6.1 The Debug View
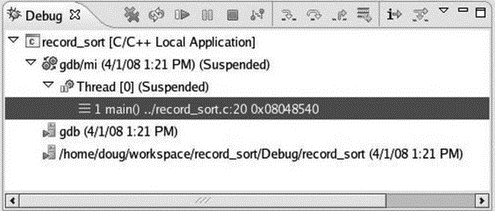
In the Debug view, right-click on the top level project entry and select Relaunch to start another debug run. The Debug view, shown in Figure 4.7, displays the state of the program in a hierarchical form. At the top of the hierarchy is a launch instance, that is, an instance of a launch configuration identified by its name. Below that is the debugger instance, identified by the name of the debugger, in this case, gdb. Beneath the debugger are the program threads under the debugger’s control. For record_sort there is just one thread. In the next chapter we’ll see how gdb/Eclipse handles multithreaded programs.

Figure 4.7: Debug view.
Finally, at the lowest level are the thread’s stack frames, identified by function name, source code line, and program counter. Currently there is only one stack frame for main(), stopped at record_sort.c, line 20.
The Debug view’s tool bar has lots of buttons for managing program execution as shown in Table 4.1.
Table 4.1: Debug Tool Bar Buttons
| Button | Name | Function |
|---|---|---|

|
Remove all Terminated Launches | Clear all terminated processes in the Debug view. |

|
Restart | Start a new debug session for the selected process. |

|
Resume | Resume execution of the currently suspended debug target. |

|
Suspend | Halt execution of the currently selected thread in the debug target. |

|
Terminate | End the selected debug session and/or process. Behavior depends on the selected item’s type. |

|
Disconnect | Detach the debugger from the selected process. |

|
Step Into | If the execution point (program counter) is on a line that includes a function call, step into the function and stop at its first line. |

|
Step Over | Step over any called functions in the current source line and stop at the next line in the current function. |

|
Step Return | Execute to the end of the current function and stop at the next line of the caller. |

|
Drop to Frame | Re-enter the selected stack frame. |

|
Instruction Stepping Mode | Activate instruction stepping mode to follow execution one instruction at a time. |

|
Use Step Filters | Activate step filters in the Debug view. |
The Debug view tool bar also has a menu with two items:
• Show Full Paths: Toggles between showing the full path to the source files and just the file name. In practice, most of the time the path is just ../ anyway.
• View Management: The Debug view can automatically open and close views based on selection. This lets you select in which perspectives this feature should be enabled. Normally you would only want to enable this in the Debug perspective.
Click Step Over once and then click Step Into to get into the read_file() function. Note that a second stack frame appears in the Debug view and sort_utils.c is opened in the Editor. At this point it would be worth taking a closer look at the four tabbed views in the upper right of the workbench.
- Data Binding Using the GridView Control
- Viewing Your System's File Systems
- Making the Publisher Field Editable
- 5.3.1 The Signals View
- 4.6.6 Finish Debugging
- Overview
- Other Uses for Conditions
- Other STL Web sites
- 4.5 Building the Project
- 4.4.4 The Dispatcher
- About the author
- Chapter 7. The state machine


