Книга: Embedded Linux development using Eclipse
5.4.6 Debugging on the Target
5.4.6 Debugging on the Target
From a developer’s standpoint, there’s virtually no difference between debugging on host and debugging on a target board. The only difference is in how Eclipse connects to the debugger. For this you’ll need to create a new debug configuration.
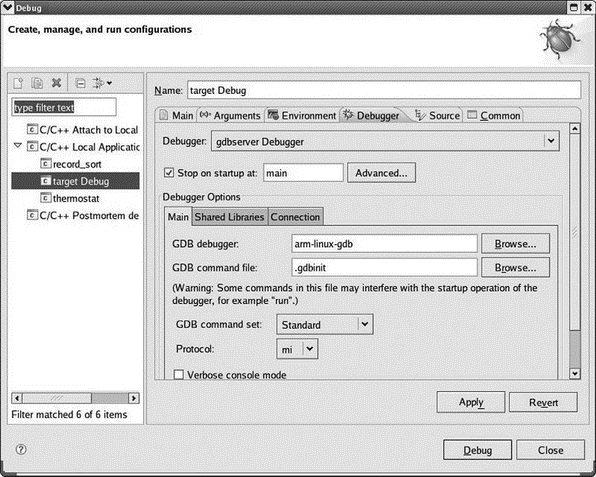
With the target project selected in the Project Explorer view, select Run?Debug Configurations…. Click the New launch configuration button. A new configuration named target Debug is created, referencing the target project and the Debug/target application. Select the Debugger tab (Figure 5.12).

Figure 5.12: Target debug configuration.
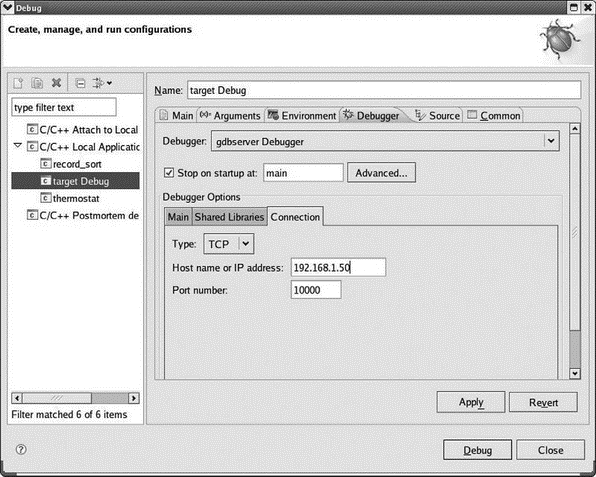
Open the Debugger drop-down menu and select gdbserver Debugger. Enter the name of your cross gdb in the GDB debugger field. Click the Connection tab under Debugger Options. Select TCP from the Type drop-down and enter the IP address of your target in the Host name or IP address field (Figure 5.13). Click Apply and then Close. GDB is now configured to talk to your target board over the network.

Figure 5.13: Target debug connection.
But before starting up a debug session, you have to start the application running on the target:
1. Execute minicom from a shell window on the host.
2. Power up your target board and boot into Linux.
3. In minicom, cd /home and verify that it has the same contents as ~/workspace on the host. If not, go back to the section on configuring networking and see if anything isn’t right. Try executing the mount command manually from the shell.
4. cd target/Debug.
5. Execute gdbserver :10000 target.
This last command starts gdbserver telling it to listen for a connection on TCP/IP port 10000, which is the default port assigned in the Eclipse configuration, and start up the target executable. gdbserver responds that it created a process for the target executable and that it is listening on port 10000. Note, incidentally, that you can use any port number you want as long as both sides use the same number and it doesn’t conflict with some other network service. Port numbers below 1024 are reserved for established services and shouldn’t be used.
Back in Eclipse, you should be in the C/C++ perspective. Select the target project in the Project Explorer view and execute Run?Debug. Eclipse switches to the Debug perspective and you should see virtually the same thing you did earlier with the simulation version of the thermostat. On the target, gdbserver responds that it has established a debugging session with host 192.168.1.2.
Play around with it to confirm that the target version really does behave like the simulation version. Note that program I/O is through the minicom window. When you’re finished terminate the debug session. gdbserver responds that its child process, the target executable, has exited and then gdbserver itself exits.
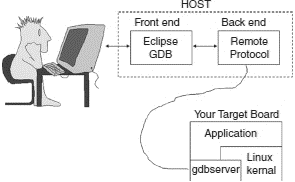
Figure 5.14 attempts to put this whole process into graphical perspective. GDB itself is conceptually split into two major components that you can think of as the “front end” and the “back end.” The front end is effectively a client and provides the user interface. The back end is a server that controls and interacts with the program under test.

Figure 5.14: GDB architecture.
The back end is architecture-dependent so it knows how to do things like disassemble machine code and set breakpoints. When we debugged the simulation thermostat, the back end simply ran the program under test on the workstation.
Things got a little more complicated when we moved to debugging on a remote target board. Now the back end running on the host has to know that it’s not running the program under test locally, but rather becomes a client to gdbserver running the program under test on the target. GDB provides a well-defined protocol for this communication. The primary role of gdbserver is to get and set memory locations and processor registers, and to maintain control over execution of the program under test.
The existence of a well-defined and public protocol for communicating between the GDB back end and gdbserver opens other possibilities for communicating with the target. Specifically, vendors of In Circuit Emulators (ICE) and JTAG boxes can use that protocol to make their products useable from GDB and Eclipse.
- Conventions used in this document
- Chapter 12. Debugging your scripts
- Iptables debugging
- Build Options
- 5.1.1. The Image Object
- Appendix D. SDRAM Interface Considerations
- Other File Systems Available to Fedora
- 2.2.2. Starting the Target Board
- 4.4.4 The Dispatcher
- About the author
- Chapter 7. The state machine
- Chapter 11. Iptables targets and jumps


