Книга: Embedded Linux development using Eclipse
5.3 Debugging Multi-Threaded Programs
The thermostat program uses POSIX threads (pthreads) to create two independent threads of execution: the thermostat state machine, and the monitor that looks for parameter changes. Fortunately, Eclipse and gdb are very good at handling multithreaded programs.
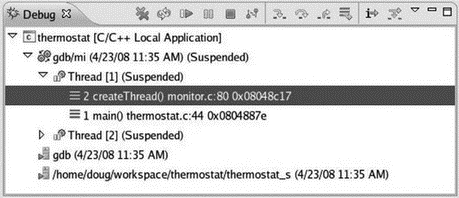
Set a breakpoint at the call to createThread() and resume the program. Step into createThread() and step until the pthread_create() function executes. The Debug view now shows that a second thread has been created (Figure 5.6). Thread [1] is suspended in createThread() as we expect.

Figure 5.6: Multi-threaded debug.
Thread [2] is also suspended. Expand its entry in the Debug view and you’ll see that it is suspended in the clone() function. clone() is a Linux system service, that like fork(), creates a child process but offers finer control over what gets shared between parent and child. Thus it is useful for creating kernel-schedulable threads that share their parent process’s global data space.
At this point we would probably want to gain control of the monitor thread to watch its execution. monitor.c should already be open in an Editor window since we’ve been stepping through a function in that file. Scroll back up to find the monitor() function that executes Thread [2]. How do we know that that’s the right function? Well, monitor is the start_routine argument to pthread_create().
Set a breakpoint on the line following the call to fgets(). fgets() doesn’t return until you enter a string on stdin. Click the Step Return button to get back to main(). Expand Thread [2]’s entry in the Debug view and you’ll see that it’s now way down deep somewhere in the kernel having called fgets() from monitor().
At this point you might want to step through initDigIO() and initAD() just to see what they do. When you’re finished, click the Resume button to let the program execute. The Debug view shows that both threads are Running and sample data starts appearing in the Console view.
Enter a new A/D value in devices and watch it show up in the thermostat output. In the same Console view, enter a parameter command, say “s 44,” to change the setpoint. Note that the Console view must have the focus to type something into it. This causes both threads to suspend with Thread [2] at the breakpoint, as we would expect. Thread [1] is deep inside the kernel having called the sleep() system service. You can now step through the execution of monitor() as it parses the command you just entered.
The next thing we might want to do is trace the execution of Thread [1] as it executes a state change. thermostat.c should still be open in an Editor window, so select that tab. Set a breakpoint on the switch (state) line. Now in the Breakpoints view, open the Properties page for the breakpoint you just created and set the Condition as “value setpoint + deadband.” Incidentally, you can simply copy and paste that expression from thermostat.c rather than having to type it.
Let the program resume and enter a new A/D value that is in fact greater than the setpoint you just entered plus the default deadband of 1. The condition for our new breakpoint is satisfied, and so the program suspends. We can now step through and verify that a state transition occurs and the “cooler” gets turned on.
Resume the program, but note that the breakpoint will be triggered again on the next pass through the loop because the condition is still true. You might want to change the condition to observe the transition to the LIMIT state.
This then is the general strategy for debugging multi-threaded applications. Strategically place breakpoints in the threads of interest and watch them interact. But what if you guess wrong and none of your breakpoints are triggered, or the breakpoints aren’t triggered because the program isn’t behaving as you expect?
In this case the Suspend button lets you regain control of the program. Suspend sends a SIGINT signal to the currently selected thread to suspend the program. Chances are the thread is not executing your source code but is somewhere inside the kernel with no symbol information available. This brings up a new Editor window with the notation “No source available for “”” and a View Disassembly button.
You can click View Disassembly to see the actual machine code being executed when the signal was received, but it’s probably not terribly enlightening. The most useful thing to do is select the stack frame for your thread function to show where it is executing. Set a breakpoint immediately after that line and you’ll regain control in your thread function.
- Одновременный запуск нескольких копий сервера (multi-instancing)
- Chapter 12. Debugging your scripts
- Multiport match
- Debugging, a necessity
- Bash debugging tips
- System tools used for debugging
- Iptables debugging
- Other debugging tools
- 2. How to Apply These Terms to Your New Programs
- CHAPTER 7 Multimedia
- Multimedia
- Apache Multiprocessing Modules


