Книга: Mastering VMware® Infrastructure3
Monitoring Host and Virtual Machine CPU Usage
Разделы на этой странице:
Monitoring Host and Virtual Machine CPU Usage
When monitoring a virtual machine, it's always a good starting point to keep an eye on CPU consumption. Many virtual machines started out in life as underperforming physical servers. One of VMware's most successful sales pitches is being able to take all those lackluster physical boxes that are not busy and convert them to virtual machines. Thus, a server starts life physical, but then goes through a midlife crisis and converts to the religion of virtualization. Once converted, virtual infrastructure managers tend to think of these new converts as simple, lackluster, and low-utilization servers with nothing to worry over or monitor. The truth, though, is quite the opposite.
When the server was physical, it had an entire box to itself. Now it must share its resources with many other siblings. In aggregate, they represent quite a load and if some or many of them become somewhat busy, they fight with each other for the finite capabilities of the ESX Server they run on. Of course, they don't know they are fighting, but the VMkernel tries to placate them. Virtual CPUs need to be scheduled, and it does a remarkable job given that there are more virtual machines than physical processors most of the time. But in every virtual infrastructure manager's life, there comes a day when one virtual machine becomes unhappy. Usually it sends a surrogate, the application owner, to tell the manager that this server was a lot happier when it was physical. But since the conversion, life has not been the same. It is now time for the manager to convert to the religion of virtual machine monitoring and figure out what is making this virtual machine so unhappy. Thankfully, VMware Infrastructure 3 (VI3) has all the tools to make such monitoring and analysis very easy.
Let's begin with a hypothetical scenario. A help desk ticket has been submitted indicating that an application owner isn't getting the expected level of performance on a particular server, which in this case is a virtual machine. A virtual infrastructure manager needs to delve deeper into the problem, asking as many questions as necessary to discover what the application owner needs to be happy. Some performance issues are subjective, meaning some users may complain about the slowness of their applications, but they have no objective benchmark for such a claim. Other times, this is reflected in a specific benchmark, such as the number of transactions by a database server or throughput for a web server. In this case, our issue revolves around benchmarking CPU usage, so our application is CPU-processing intensive when it does its job.
Assessments, Expectations, and Adjustments
If an assessment was done prior to virtualizing a server, there may be hard numbers to look at to give some details as to what was expected with regard to minimum performance or service-level agreement (SLA). If not, the virtual infrastructure manager needs to work with the application's owner to make more CPU resources available to the unhappy virtual machine when needed.
VirtualCenter's graphs, which we have explored in great detail, are the best way to analyze usage, both short- and long-term. The great thing about the graphs is that they can tell a story about how the virtual machine has performed in the last hour, day, week, month, or even year. Maybe the help desk ticket describes a slowness issue in the last hour. As Figure 11.37 shows, we can look at the virtual machine's ability to work for the last hour.
Perform these steps to create a CPU graph:
1. Connect to the VirtualCenter server or an individual ESX Server host with the VI Client.
2. In the inventory tree, click on a virtual machine. This shows you the Summary tab. Click the Performance tab, as shown in Figure 11.37.
3. Click the Change Chart Options link.
4. Under Chart Options, click on the Network bulls-eye or the + sign, as shown in Figure 11.38. This view allows you to select the objects and counters that will provide the most relevant information. Real-time CPU graphs have a lot of counters, but usually only a few are used for any one graph. In this case, we'll use CPU Usage in MHz (Average/Rate) and CPU Ready to see how much physical processor is being used and how long on average it's taking the virtual machine to be scheduled on a physical processor.
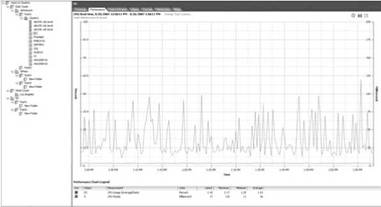
Figure 11.37 The Performance tab is your starting point.
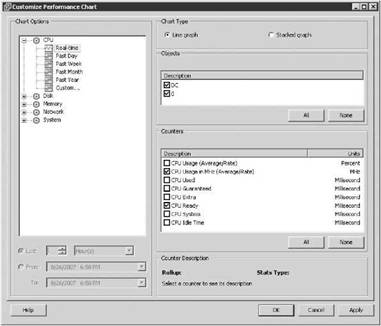
Figure 11.38 The default resource for a virtual machine is CPU.
CPU Ready
CPU Ready is a special counter only available using the Real-time interval. A virtual machine waiting many thousands of milliseconds to be scheduled on a processor may indicate that the ESX Server is overloaded, a resource pool has too tight a limit, the virtual machine has too few CPU shares, or, if no one is complaining, nothing at all. Be sure to work with the server or application owner to determine an acceptable amount of CPU Ready for any CPU-intensive virtual machine.
5. Select those relevant objects and counters to provide the information needed, as shown in Figure 11.39. Then, choose the chart type and click OK.
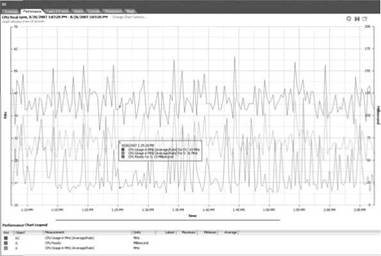
Figure 11.39 The graph shows the virtual machine's CPU consumption and how long, in milliseconds, it takes to schedule the virtual machine on a physical processor.
Monitoring a host's overall CPU usage is fairly straightforward. Keep in mind that other factors usually come into play when looking at spare CPU capacity. Add-ons such as VMotion, DRS, and HA directly impact whether there is enough spare capacity on a server or a cluster of servers. With ESX 3.x, the Service Console will usually not be as competitive for processor 0 since there are fewer processes to consume CPU time. Agents installed on the Service Console will have some impact, again on processor 0.
Service Console Stuck on 0
The Service Console, as noted, uses processor 0. But note that it will only use processor 0. The Service Console does not get migrated to other processors even in the face of heavy contention.
Follow these steps to create a real-time graph for a host's CPU usage:
1. Connect to the VirtualCenter server or an individual ESX Server host with the VI Client.
2. In the inventory tree, click on a host. This shows you the Summary tab. Click the Performance tab, as shown in Figure 11.40.
3. Click the Change Chart Options link.
4. Under Chart Options, click on the Network bull's-eye or the + sign, as shown in Figure 11.41. The objects to choose from are the physical, hyper-threaded, or core processors. There are two often-used counters in this customization dialog box: CPU Usage (Average/Rate) and CPU Reserved Capacity. Both are used to see how an individual ESX Server is being utilized. CPU Usage shows actual usage, and CPU Reserved Capacity shows how much usage is left.
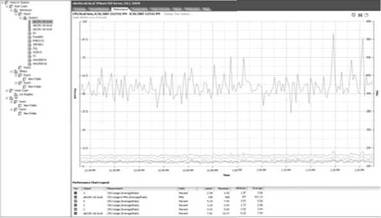
Figure 11.40 The Performance tab is the central focus of obtaining information about virtual machine or host performance levels.
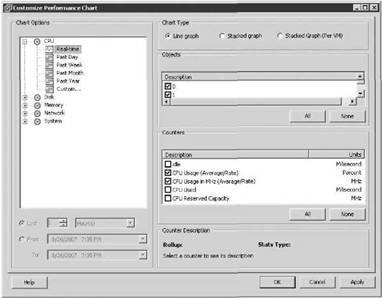
Figure 11.41 Looking at host processor usage and spare capacity.
CPU Reserved Capacity
The CPU Reserved Capacity counter can be used to monitor spare capacity for a single ESX Server. However, if DRS has been enabled, the Resource Allocation tab for the Cluster inventory object is more relevant since it shows cluster usage and spare capacity at a glance for all servers in a cluster.
5. Select those relevant objects and counters to provide the information required, as shown in Figure 11.42. If necessary, choose the chart type. Click OK.
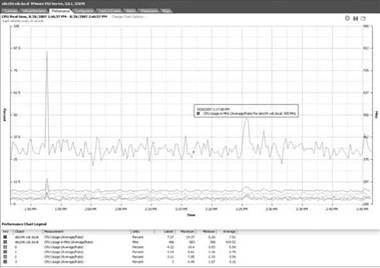
Figure 11.42 This graph displays the host's overall usage and reserve capacity.
VMkernel Balancing Act
Always remember that on an oversubscribed ESX Server, the VMkernel will load balance the virtual machines based on current loads, reservations, and shares represented on individual virtual machines and/or resource pools.
By looking at the Resource Allocation tab for a Cluster or Resource Pool inventory object, we can get a picture of how CPU resources are being used for the entire pool (see Figure 11.43). This high-level method of looking at resource usage is useful for analyzing overall infrastructure utilization. This tab does a good job of adjusting individual virtual machine or resource pool reservations, limits, and/or shares without editing each object independently.
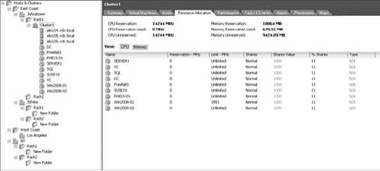
Figure 11.43 This tab displays the cluster's overall usage and reserve capacity.
- Разработка приложений баз данных InterBase на Borland Delphi
- Open Source Insight and Discussion
- Introduction to Microprocessors and Microcontrollers
- Chapter 6. Traversing of tables and chains
- Chapter 7. The state machine
- Chapter 8. Saving and restoring large rule-sets
- Chapter 11. Iptables targets and jumps
- Chapter 5 Installing and Configuring VirtualCenter 2.0
- Chapter 16. Commercial products based on Linux, iptables and netfilter
- Appendix A. Detailed explanations of special commands
- Appendix B. Common problems and questions
- Appendix E. Other resources and links
