Книга: Fedora™ Unleashed, 2008 edition
Using Priority Scheduling and Control
Using Priority Scheduling and Control
No process can make use of the system's resources (CPU, memory, disk access, and so on) as it pleases. After all, the kernel's primary function is to manage the system resources equitably. It does this by assigning a priority to each process so that some processes get better access to system resources and some processes might have to wait longer until their turn arrives. Priority scheduling can be an important tool in managing a system supporting critical applications or in a situation in which CPU and RAM use must be reserved or allocated for a specific task. Two legacy applications included with Fedora include the nice and renice commands. (nice is part of the GNU sh-utils package, whereas renice is inherited from BSD UNIX.)
The nice command is used with its -n option, along with an argument in the range of -20 to 19, in order from highest to lowest priority (the lower the number, the higher the priority). For example, to run the gkrellm client with a low priority, use the nice command like this:
$ nice -n 12 gkrellm &
The nice command is typically used for disk- or CPU-intensive tasks that might be obtrusive or cause system slowdown. The renice command can be used to reset the priority of running processes or control the priority and scheduling of all processes owned by a user. Regular users can only numerically increase process priorities (that is, make tasks less important) with this command, but the root operator can use the full nice range of scheduling (-20 to 19).
System administrators can also use the time command to get an idea of how much time and what proportion of a system's resources are required for a task, such as a shell script. (Here, time is used to measure the duration of elapsed time; the command that deals with civil and sidereal time is the date command.) This command is used with the name of another command (or script) as an argument like this:
# time -p find / -name core -print

/dev/core

/proc/sys/net/core

real 1.20

user 0.14

sys  0.71
Output of the command displays the time from start to finish, along with the user and system time required. Other factors you can query include memory, CPU use, and file system input/output (I/O) statistics. See the time command's man page for more details.
Nearly all graphical process-monitoring tools include some form of process control or management. Many of the early tools ported to Linux were clones of legacy UNIX utilities. One familiar monitoring (and control) program is top. Based on the ps command, the top command provides a text-based display of constantly updated console-based output showing the most CPU-intensive processes currently running. It can be started like this:
# top
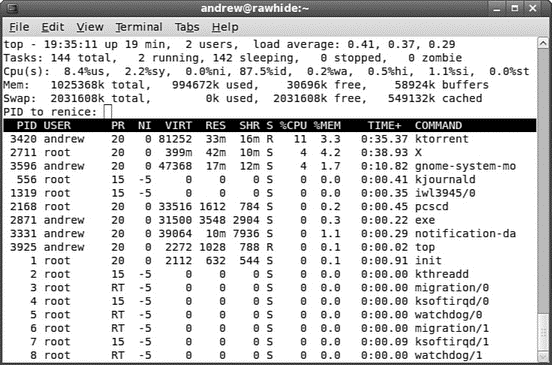
After you press Enter, you see a display as shown in Figure 12.1. The top command has a few interactive commands: Pressing h displays the help screen; pressing k prompts you to enter the PID of a process to kill; pressing n prompts you to enter the PID of a process to change its nice value. The top man page describes other commands and includes a detailed description of what all the columns of information top can display actually represent; have a look at top's well-written man page.

FIGURE 12.1 The top command can be used to monitor and control processes. Here, we are prompted to renice a process.
The top command displays quite a bit of information about your system. Processes can be sorted by PID, age, CPU or memory use, time, or user. This command also provides process management, and system administrators can use its k and r keypress commands to kill and reschedule running tasks, respectively.
The top command uses a fair amount of memory, so you might want to be judicious in its use and not leave it running all the time. When you've finished with it, simply press q to quit top.
- KDE Process- and System-Monitoring Tools
- 9.1.3 Control Field
- 5.5.3 Contention scope and allocation domain
- 7. Macros: Standard Control Constructs
- Control Panel Components
- Building Control Panel Applets
- Разработка приложений баз данных InterBase на Borland Delphi
- Open Source Insight and Discussion
- SERVER PRIORITY CLASS
- Introduction to Microprocessors and Microcontrollers
- Chapter 6. Traversing of tables and chains
- Chapter 8. Saving and restoring large rule-sets


