Книга: Microsoft Windows Embedded CE 6.0 Exam Preparation Kit
Enabling and Managing Breakpoints
Enabling and Managing Breakpoints
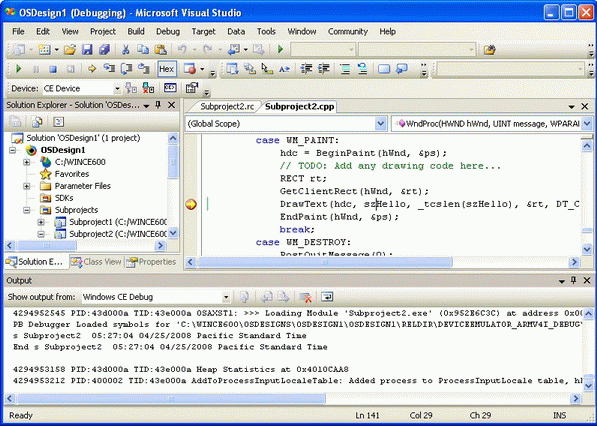
The debugging features of Platform Builder provide most of the functionality also found in other debuggers for Windows desktop applications. You can set breakpoints, step through the code line-by-line, and use the Watch window to view and change variable values and object properties, as illustrated in Figure 4-8. Keep in mind, however, that the ability to use breakpoints depends on the existence of the KdStub library in the run-time image.

Figure 4-8 Debugging a Hello World application
To set a breakpoint, use the Toggle Breakpoint option on the Debug menu in Visual Studio. Alternatively, you can press F9 to set a breakpoint at the current line or click the left margin area of the code line. According to your selection, Platform Builder indicates the breakpoint with a red dot or a red circle, depending on whether the debugger can instantiate the breakpoint or not. The red circle indicates an un-instantiated breakpoint. Un-instantiated breakpoints occur if the Visual Studio instance is not linked to the target code, the breakpoint is set but has not yet been loaded, the debugger is not enabled, or if the debugger is running but code execution has not yet halted. If you set a breakpoint while the debugger is running, then the device must break into the debugger first before the debugger can instantiate the breakpoint.
You have the following options to manage breakpoints in Visual Studio with Platform Builder:
? Source code, Call Stack, and Disassembly windows You can set, remove, enable, or disable a breakpoint by either pressing F9 and selecting Toggle
Breakpoint from the Debug menu or selecting Insert/Remove Breakpoint from the context menu.
? New Breakpoint dialog box You can display this dialog box via the submenus available under New Breakpoint on the Debug menu. The New Breakpoint dialog box enables you to set breakpoints by location and conditions. The debugger stops at a conditional breakpoint only if the specified condition evaluates to TRUE, such as when a loop counter or other variable has a specific value.
? Breakpoints window You can display the Breakpoints window by clicking Breakpoints under the Windows submenu on the Debug menu, or by pressing Alt+F9. The Breakpoints window lists all set breakpoints and enables you to configure breakpoint properties. For example, instead of using the New Breakpoint dialog box, which requires you to specify location information manually, you can set the desired breakpoint directly in the source code and then display the properties of this breakpoint in the Breakpoints window to define conditional parameters.
TIP
Too many breakpoints
Use breakpoints sparingly. Setting too many breakpoints and constantly selecting Resume impacts debugging efficiency and makes it hard to focus on one aspect of the system at a time. Consider disabling and re-enabling breakpoints as necessary.
- Разработка приложений баз данных InterBase на Borland Delphi
- Open Source Insight and Discussion
- Introduction to Microprocessors and Microcontrollers
- Chapter 6. Traversing of tables and chains
- Chapter 8. Saving and restoring large rule-sets
- Chapter 11. Iptables targets and jumps
- Chapter 5 Installing and Configuring VirtualCenter 2.0
- Chapter 16. Commercial products based on Linux, iptables and netfilter
- Appendix A. Detailed explanations of special commands
- Appendix B. Common problems and questions
- Appendix E. Other resources and links
- IP filtering terms and expressions


