Книга: Embedded Linux development using Eclipse
7.3.3 Running and Debugging a Plug-In
7.3.3 Running and Debugging a Plug-In
Eclipse and PDE have a notion of self-hosting, which means that we can launch a new instance of Eclipse with plug-ins we’re currently working on, without having to export or deploy any plug-ins. One way to start the new instance is to go back to the Overview form in the Manifest Editor and click on Launch an Eclipse application under Testing. You can also just click on the Run icon in the menu toolbar or, from the top-level project context menu in the Package Explorer view, select Run As?Eclipse Application.
After a little churning, a new instance of Eclipse appears in the default C/C++ perspective. Interestingly, it doesn’t ask for a workspace location. Instead, it creates a workspace in your home directory, called runtime-EclipseApplication.
In the main menu select Window?Show View?Other. Expand the EclipseBook entry and select SuperView. The new view shows up in the bottom window.
Now that you know what the plug-in does, go back into the Java code and try to figure out how it does it.
Debugging is virtually identical to what we did with CDT. The one “gotcha” here is that there’s no “Stop on main.” This means you must have a breakpoint set before you launch the debug run. Open SuperView.java if it’s not already open. Now switch to the Debug perspective. This is essentially the same Debug perspective we used for C programming, but now we’re using a Java debugger instead of gdb.
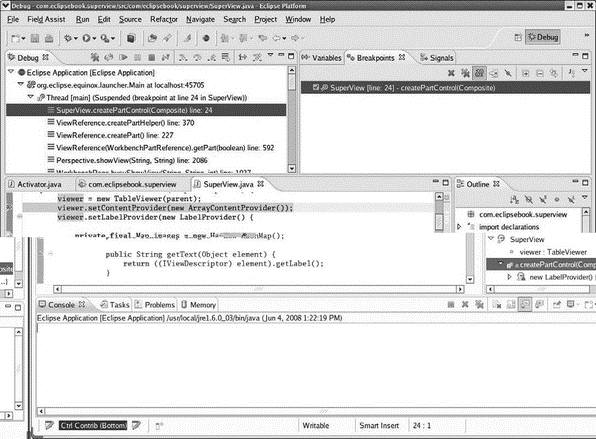
Scroll down to line 24 in SuperView.java that starts with viewer.setContentProvider… and set a breakpoint just as we did before. Now from the Manifest Editor Overview form, click Launch an Eclipse application in Debug mode. The new Eclipse instance starts as before. Select the SuperView view as we did above and the program hits the breakpoint (Figure 7.8).

Figure 7.8: Java Debug perspective.
The Debug view shows the call stack with the method containing the breakpoint highlighted. If you select any other frame in the call stack, a window appears in the editor saying that the source is not available. Nevertheless, the local variables for that frame are displayed in the Variables view and the Outline view shows an outline of the corresponding method.
Note, incidentally, that the debug instance of Eclipse is blank and waiting for something to happen. You can step through the createPartControl() method to see what happens, but in fact nothing actually changes on the workbench until after setFocus() is called.
Without going into a lot of detail, let’s take a quick look at what createPartControl() does. First it creates a table-like visual component, a “table viewer,” to display your view’s contents. It then configures the viewer with a content provider and a label provider. The former allows the viewer to navigate your model, or more specifically, to extract your model’s structural elements suitable for inclusion in a table. The latter allows it to convert your model’s elements into table cells with textual labels and optional images.
Then there’s a sorter to display the entries in alphabetical order. Finally, you provide an input source that is an array of descriptors of all views available in the workbench at run-time. Note that we’re providing an implementation of setLabelProvider() here, and we’re overriding the getText() and getImage() methods.
- 7.3 Our First Plug-In
- Разработка приложений баз данных InterBase на Borland Delphi
- Open Source Insight and Discussion
- Introduction to Microprocessors and Microcontrollers
- Chapter 6. Traversing of tables and chains
- Chapter 8. Saving and restoring large rule-sets
- Chapter 11. Iptables targets and jumps
- Chapter 12. Debugging your scripts
- Chapter 5 Installing and Configuring VirtualCenter 2.0
- Chapter 16. Commercial products based on Linux, iptables and netfilter
- Appendix A. Detailed explanations of special commands
- Appendix B. Common problems and questions


