Книга: Writing Windows WDM Device Drivers
Bugcheck Codes
Bugcheck Codes
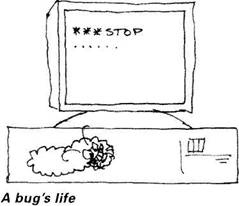
When Windows 2000 bugchecks, it displays information in the "blue screen of death" and stops dead. The information on this screen can help you to track down the source of the problem. You can cause a bugcheck deliberately using the KeBugCheck and KeBugCheckEx routines. A debug version of your driver might do this if it detects some unsolvable problem. Release drivers should never bugcheck voluntarily.
A problem in your driver may not directly cause a bugcheck. For example, you could overwrite another driver's memory and cause it to fail.
The top few lines of the bugcheck screen contain the most useful information. Down below might be a module list, a stack trace, and instructions. In NT, then it will say that is producing a physical dump of memory even if you have not enabled this option in the Control Panel System applet.
The most common bugcheck codes are listed in Table 6.2. The full list of stop codes is given in DDK bugcodes.h. The exception codes for "Unhandled Kernel exception" bugchecks are in the NTSTATUS.H header in the DDK.
For example, put this code in the Wdm1 driver.
char* NULLptr = NULL;

*NULLptr = 5;
This does not cause any errors in W98. However, in W2000, the following bugcheck occurs. (Interestingly, a read from address 0x0 does not seem to cause a bugcheck in W2000.)
*** STOP: 0x0000001E (0xC0000005,0xF2D7B875.0x00000001,0x00000000)

KMODE_EXCEPTION_NOT_HANDLED

*** Address 0xF2D7B875 base at 0xF2D7A000 Datestamp 362DF72F – Wdm1.sys
The bugcheck code is 0x0000001E, which translates as an "Unhandled Kernel exception". The four numbers in brackets are the four extra parameters that are passed to KeBugCheckEx. Table 6.2 shows the interpretations for the common bugcheck codes. For this bugcheck, the first parameter is the exception code. 0xC0000005 indicates an access exception. The fourth parameter indicates the memory address that you tried to access (0x0) and the second parameter gives the address of the instruction that caused the exception. The exception occurred at address 0xF2D7B875, a little way into the code of Wdm1, which is loaded at 0xF2D7A000.

Table 6.2 Common bugchecks
Code 0x0000000A IRQL_NOT_LESS_OR_EQUAL 1 Address referenced 2 IRQL (Not the correct IRQL) 3 0=read, 1=write 4 Address that referenced memory A driver tried to do something at an inappropriate IRQL (e.g., accessing paged memory at DISPATCH_LEVEL IRQL or higher) |
Code 0x0000001E KMODE_EXCEPTION_NOT_HANDLED 1 Exception code: 0xC00000005 2 Address where exception occurred 3 4 Address referenced Access violation |
Code 0x0000001E KMODE_EXCEPTION_NOT_HANDLED 1 Exception code: 0x80000003 2 Address where exception occurred Hard-coded breakpoint or ASSERT hit. |
Code 0x000000BE Driver attempted to write to read-only memory |
Code 0x000000C4 Driver Verifier detected exception. See its documentation for details. |
Where Did the Bugcheck Happen?
How do you work out what code caused the bugcheck? By analyzing the linker map for a driver, you can work out which routine caused the problem. A source-level debugger is required if you are still having problems.
You build a linker map by adding a line like the following to your SOURCES file.
LINKER_FLAGS=-MAP:Wdm2.map
What routine caused the following access violation?
*** STOP: 0x0000001E (0xC0000005,0xF764C5F1,0x00000000,0x00000010)

KMODE_EXCEPTION_NOT_HANDLED

*** Address 0xF764C5F1 base at 0xF764A000 Datestamp 3653e5fb – Wdm2.sys
The first thing to note is that the access violation occurs at a very low address, 0x10. This suggests that the code had a NULL pointer to a structure and was trying to access a field at offset 0x10 in this structure. This turned out to be the case.
The problem seems to be in the Wdm2 driver. The offset into the executable image is 0xF764C5F1-0xF764A000 (i.e., 0x25F1).
Listing 6.2 shows part of the linker map for this build of the Wdm2 driver. The initial section shows that the load address is 0x00010000. The map then lists the segments that make up the executable image. However, the information of interest is buried in the next section, which lists each code and data object.
The entry for PnpDefaultHandler in Pnp.cpp has an Rva+Base of 0x00012512. If the load address is taken off, this shows that PnpDefaul tHandler starts at offset 0x2512. The next line shows that the ForwardAndWait routine starts at 0x2611. Therefore, the access violation at offset 0x25Fl occurred towards the end of the PnpDefaultHandler routine.
Listing 6.2 Wdm2 linker map excerpt
Wdm2

 Timestamp is 3653e5fb (Thu Nov 19 09:33:47 1998) Preferred load address is 00010000

 Start         Length    Name     Class

 0001:00000000 0000152cH .text    CODE

 0002:00000000 000000a0H .idata$5 DATA

 0002:000000a0 00000632H .rdata   DATA

 0003:00000000 00000119H .data    DATA

 0003:00000120 00000042H .bss     DATA

 0004:00000000 00000c1aH PAGE     CODE

 0005:00000000 000000eeH INIT     CODE

 0005:000000f0 00000028H .idata$2 CODE

 0005:00000118 00000014H .idata$3 CODE

 0005:0000012c 000000a0H .fdata$4 CODE

 0005:000001cc 00000344H .idata$6 CODE

 0006:00000000 00000058H .rsrc$01 DATA

 0006:00000060 00000338H .rsrc$02 DATA

 Address       Publics by Value                                      Rva+Base   Lib:Object

 0001:00000012 ?Wdm1Create@@YGJPAU_DEVICE_OBJECT@@PAU_IRP@@@Z        000102f2 f dispatch.obj

 0001:00000056 ?Wdm1Close@@YGJPAU_DEVICE_OBJECT@@PAU_IRP@@@Z         00010336 f dispatch.obj

 …

 0004:00000492 ?PnpDefaultHandler@@YGJPAU_DEVICE_OBJECT@@PAU_IRP@@@Z 00012512 f pnp.obj

 0004:00000591 ?ForwardAndWait@@YGJPAU_DEVICE_OBJECT@@PAU_IRP@@@Z    00012611 f pnp.obj


