Книга: Learning GNU Emacs, 3rd Edition
Warning
Warning
Before we touch anything, you need to make sure that your classes are compiled with support for debugging. Otherwise, many things will appear broken when you run the debugger.
To add debug support when you compile, you run the javac command with the -g option. With the JDEE you can also use the variable jde-compile-option-debug to hold all the variations for debugging you like. If you customize this variable through Custom (see Chapter 10), just choose the "all" option for which debugging information to include. (Optionally, you can be more specific and select from the three types of debug information: Lines, Variables, and Source.)
We'll look at the jdb route just to get you started. You can start the debug session by typing M-x jde-jdb. The same variables that control the starting directory and main application class are used for debugging purposes.
After you have launched the debugger, you can control the debug process in a number of ways.
• Interact directly with the jdb process in the *debug* buffer. Here you can type any command that you would normally give when running jdb.
• Use the Jdb menu. You have all the usual debug options available: step into/over, continue, toggle breakpoint, and so on. This is a bit more limited than the first approach, but easier to manage if you're new to jdb.
• Use keyboard commands while you're in your source buffer. These commands are even more limited than the menu options, but give you really quick access to the most common tasks (namely stepping and break points). Table 9-8 shows the commands that are available while you're in a source buffer.
Table 9-8. JDEE debugger controls
| Keystrokes | Menu item | JDB command |
|---|---|---|
| C-c C-a C-s | Step Into | step |
| C-c C-a C-n | Step Over | next |
| C-c C-a C-c | Continue | cont |
| C-c C-a C-b | Toggle Breakpoint | stop in/stop at/clear |
| C-c C-a C-p | Display Expression | |
| C-c C-a C-d | Display Object | dump |
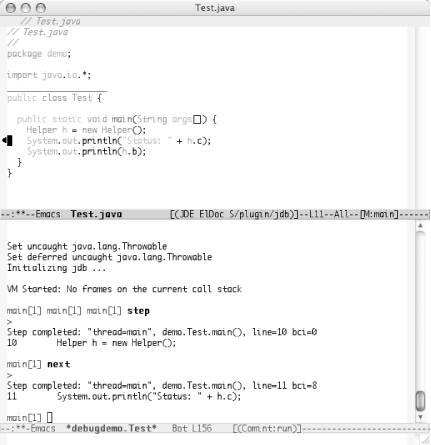
Figure 9-4 shows a simple application running in debug mode. Notice the small black triangle to the left of the Java source code in the upper buffer. That's the debug cursor that lets you know where you are in the file. It tracks the commands you issue, whether by directly entering jdb commands, by menu option, or through the keyboard.
Figure 9-4. Debugging a Java application with jdb

- #warning and #error
- #pragma warning
- 3.3.1. Сообщение Warning: Eepsite Unreachable (Предупреждение: I2P-сайт недоступен)
- 3.3.3. Сообщение Warning: Eepsite Not Found in Addressbook
- 6.5. Warning! Your IP is detected! Скрываем свое присутствие в Интернете
- Категория Warnings
- System tools used for debugging
- 8.4.4. Лишние команды
- Debugging Tools
- Mounting the New Partition and Populating It with the Relocated Files


