Книга: Embedded Linux Primer: A Practical, Real-World Approach
14.2.2. Target Boot with KGDB Support
14.2.2. Target Boot with KGDB Support
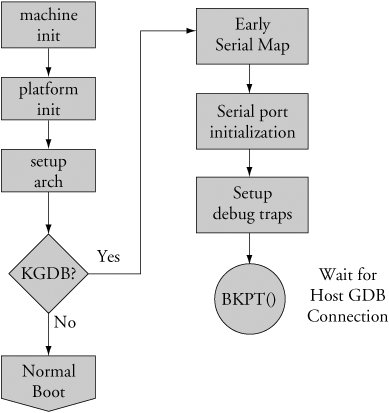
After your kernel is built with KGDB support, it must be enabled. Unfortunately, the method to enable it is not yet uniform across all architectures and implementations. In general, KGDB is enabled by passing a command line switch to the kernel via the kernel command line. If KGDB support is compiled into the kernel but not enabled via a command line switch, it does nothing. When KGDB is enabled, the kernel stops at a KGDB-enabled breakpoint very early in the boot cycle to allow you to connect to the target using gdb. Figure 14-3 shows the logic for generating an initial breakpoint when KGDB is enabled.
Figure 14-3. KGDB logic

KGDB requires a serial port for connection to the host.[91] The first step in setting up KGDB is to enable a serial port very early in the boot process. In many architectures, the hardware UART must be mapped into kernel memory before access. After the address range is mapped, the serial port is initialized. Debug trap handlers are installed to allow processor exceptions to trap into the debugger.
Listing 14-1 displays the terminal output when booting with KGDB enabled. This example is based on the AMCC 440EP Evaluation Kit (Yosemite board), which ships with the U-Boot bootloader.
Listing 14-1. Booting with KGDB Enabled Using U-Boot
=> sete bootargs console=ttyS1,115200 root=/dev/nfs rw ip=dhcp gdb

=> bootm 200000

## Booting image at 00200000 ...

   Image Name:   Linux-2.6.13

   Image Type:   PowerPC Linux Kernel Image (gzip compressed)

   Data Size:    1064790 Bytes =  1 MB

   Load Address: 00000000

   Entry Point:  00000000

   Verifying Checksum ... OK

   Uncompressing Kernel Image ... OK

$T0440:c000ae5c;01:c0205fa0;#d9  <<< See text
Most of the boot sequence is familiar from our coverage of U-Boot in Chapter 7, "Bootloaders." This kernel boot sequence has two unique features: the command-line parameter to enable KGDB and the odd-looking text string after the kernel is uncompressed.
Recall from Chapter 7 that the kernel command line is defined by the U-Boot bootargs environment variable. Notice that we have added the gdb parameter, which instructs the kernel to force an early breakpoint and wait for the host debugger (your cross-gdb) to connect.
As diagrammed in Figure 14-3, the kernel detects the presence of the gdb parameter and attempts to pass control to the remote (host-based) debugger. This is evidenced by the sequence of ASCII characters dumped to the serial port in Listing 14-1. If you are curious about this gdb remote serial protocol, it is documented in the gdb manual cited at the end of this chapter. In this example, KGDB is sending a Stop Reply packet reporting the breakpoint trap to the remote gdb session on the host. The two 32-bit parameters indicate the location of the program and the stack frame.
Now that the kernel is set up and waiting for the host debugger, we can begin our debugging session. We invoke cross-gdb from our host development workstation and connect to the target via gdb 's remote protocol. In this example, we are sharing the serial port, so we must disconnect the terminal emulator from the target before trying to connect with gdb. Listing 14-2 highlights the gdb connection process. This assumes that we have already exited our terminal emulator and freed the serial port for gdb to use.
Listing 14-2. Connecting to KGDB
$ ppc_4xx-gdb --silent vmlinux

(gdb) target remote /dev/ttyS0

Remote debugging using /dev/ttyS0

breakinst () at arch/ppc/kernel/ppc-stub.c:825

825     }

(gdb) l

820                      return;

821              }

822

823             asm("   .globl breakinst        n

824                  breakinst: .long 0x7d821008");

825     }

826

827     #ifdef CONFIG_KGDB_CONSOLE

828     /* Output string in GDB O-packet format if GDB has connected.

If nothing

829        output, returns 0 (caller must then handle output). */

(gdb)
Here we have performed three actions:
• Invoked gdb, passing it the kernel ELF file vmlinux
• Connected to the target using the target remote command within gdb
• Issued the list command, using its abbreviated form to display our location in the source code
At the risk of pointing out the obvious, the vmlinux image that we pass to gdb must be from the same kernel build that produced the target kernel binary. It also must have been compiled with the -g compiler flag to contain debug information.
When we issued the target remote command, gdb responded by displaying the location of the program counter (PC). In this example, the kernel is stopped at the breakpoint defined by the inline assembler statement at line 823 in file .../arch/ppc/kernel/ppc-stub.c. When we issue the continue (c) command, execution resumes starting at line 825, as indicated.
- 7.4.1. EP405 U-Boot Port
- 14.2. Using KGDB for Kernel Debugging
- 14.2.1. KGDB Kernel Configuration
- Chapter 11. Iptables targets and jumps
- Using Double Quotes to Resolve Variables in Strings with Embedded Spaces
- Drawbacks with restore
- ACCEPT target
- CLASSIFY target
- CLUSTERIP target
- CONNMARK target
- CONNSECMARK target
- DNAT target


