Книга: Embedded Linux Primer: A Practical, Real-World Approach
17.4.6. Interrupt Off History
17.4.6. Interrupt Off History
Enabling INTERRUPT_OFF_HIST provides functionality similar to that with WAKEUP_LATENCY_HIST. This option gathers interrupt off timing measurements into a file for later analysis. This data is formatted as a histogram, with bins ranging from 0 microseconds to just over 10,000 microseconds. In the example just given, we saw that the maximum latency was 97 microseconds from that particular sample. Therefore, we can conclude that the latency data in histogram form will not contain any useful information beyond the 97-microsecond bin.
History data is obtained by reading a special /proc file. This output is redirected to a regular file for analysis or plotting as follows:
# cat /proc/latency_hist/interrupt_off_latency/CPU0 > hist_data.txt
Listing 17-6 displays the first 10 lines of the history data.
Listing 17-6. Interrupt Off Latency History (Head)
$ cat /proc/latency_hist/interrupt_off_latency/CPU0 | head

#Minimum latency: 0 microseconds.

#Average latency: 1 microseconds.

#Maximum latency: 97 microseconds.

#Total samples: 60097595

#There are 0 samples greater or equal than 10240 microseconds

#usecs           samples

    0           13475417

    1           38914907

    2            2714349

    3             442308

...
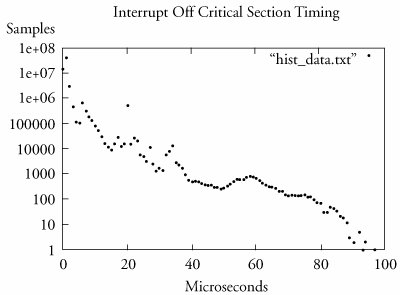
From Listing 17-6 we can see the minimum and maximum values, the average of all the values, and the total number of samples. In this case, we accumulated slightly more than 60 million samples. The histogram data follows the summary and contains up to around 10,000 bins. We can easily plot this data using gnuplot as shown in Figure 17-5.
Figure 17-5. Interrupt off latency data

- 17.4.5. Interrupt Off Timing
- Appendix G. History
- Интеграция Windows SharePoint и Microsoft Office
- Извлечение и возврат документов в приложениях Microsoft Office 2007
- Создание рабочих областей для документов из приложений Microsoft Office 2007
- Использование панели задач Управление документами в приложениях Office 2007
- Часть III Пакет Microsoft Office
- Как восстановить поврежденный файл Office
- Я что-то напутал с настройками Microsoft Office, неужели теперь все переустанавливать?
- Справочная система приложений Office
- Office Suite
- What Is in OpenOffice.org?


