Книга: Embedded Linux Primer: A Practical, Real-World Approach
14.3.1. gdb Remote Serial Protocol
14.3.1. gdb Remote Serial Protocol
gdb includes a debug switch that enables us to observe the remote protocol being used between gdb on your development host and the target. This can be very useful for understanding the underlying protocol, as well as troubleshooting targets that exhibit unusual or errant behavior. To enable this debug mode, issue the following command:
(gdb) set debug remote 1
With remote debugging enabled, it is instructive to observe the continue command in action and the steps taken by gdb. Listing 14-5 illustrates the use of the continue command with remote debugging enabled.
Listing 14-5. continue Remote Protocol Example

(gdb) c

Continuing.

Sending packet: $mc0000000,4#80...Ack

Packet received: c022d200

Sending packet: $Mc0000000,4:7d821008#68...Ack

Packet received: OK

Sending packet: $mc0016de8,4#f8...Ack

Packet received: 38600001

Sending packet: $Mc0016de8,4:7d821008#e0...Ack

Packet received: OK

Sending packet: $mc005bd5c,4#23...Ack

Packet received: 38600001

Sending packet: $Mc005bd5c,4:7d821008#0b...Ack

Packet received: OK

Sending packet: $mc021a488,4#c8...Ack

Packet received: 4bfffbad

Sending packet: $Mc021a488,4:7d821008#b0...Ack

Packet received: OK

Sending packet: $c#63...Ack

  <<< program running, gdb waiting for event
Although it might look daunting at first, what is happening here is easily understood. In summary, gdb is restoring all its breakpoints on the target. Recall from Listing 14-3 that we entered two breakpoints, one at panic() and one at sys_sync(). Later in Listing 14-4, we added a third breakpoint at yosemite_setup_arch(). Thus, there are three active user-specified breakpoints. These can be displayed by issuing the gdb info breakpoints command. As usual, we use the abbreviated version.
(gdb) i b

Num Type           Disp Enb Address    What

1   breakpoint     keep y   0xc0016de8 in panic at kernel/panic.c:74

2   breakpoint     keep y   0xc005bd5c in sys_sync at fs/buffer.c:296

3   breakpoint     keep y   0xc021a488 in yosemite_setup_arch at arch/ppc/platforms/4xx /yosemite.c:308

        breakpoint already hit 1 time

(gdb)
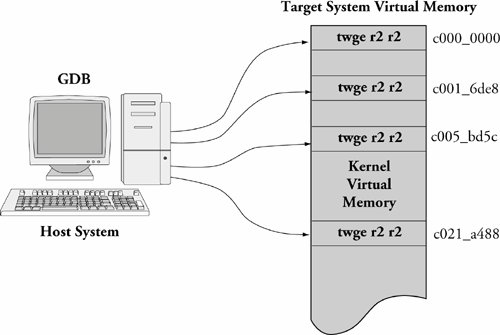
Now compare the previous breakpoint addresses with the addresses in the gdb remote $m packet in Listing 14-5. The $m packet is a "read target memory" command, and the $M packet is a "write target memory" command. Once for each breakpoint, the address of the breakpoint is read from target memory, stored away locally on the host by gdb (so it can be restored later), and replaced with the PowerPC TRap instruction twge r2, r2 (0x7d821008), which results in control passing back to the debugger. Figure 14-4 illustrates this action.
Figure 14-4. gdb inserting target memory breakpoints

You might have noticed that gdb is updating four breakpoints, whereas we entered only three. The first one at target memory location 0xc000_0000 is put there by gdb automatically upon startup. This location is the base address of the linked kernel image from the ELF fileessentially, _start. It is equivalent to a breakpoint at main() for user space debugging and is done by gdb automatically. The other three breakpoints are the ones we entered earlier.
The same thing happens in reverse when an event occurs that returns control to gdb. Listing 14-6 details the action when our breakpoint at yosemite_setup_arch() is encountered.
Listing 14-6. Remote Protocol: Breakpoint Hit
Packet received: T0440:c021a488;01:c020ff90;

Sending packet: $mc0000000,4#80...Ack <<< Read memory @c0000000

Packet received: 7d821008

Sending packet: $Mc0000000,4:c022d200#87...Ack <<< Write memory

Packet received: OK

Sending packet: $mc0016de8,4#f8...Ack

Packet received: 7d821008

Sending packet: $Mc0016de8,4:38600001#a4...Ack

Packet received: OK

Sending packet: $mc005bd5c,4#23...Ack

Packet received: 7d821008

Sending packet: $Mc005bd5c,4:38600001#cf...Ack

Packet received: OK

Sending packet: $mc021a488,4#c8...Ack

Packet received: 7d821008

Sending packet: $Mc021a488,4:4bfffbad#d1...Ack

Packet received: OK

Sending packet: $mc021a484,c#f3...Ack

Packet received: 900100244bfffbad3fa0c022

Breakpoint 3, yosemite_setup_arch () at arch/ppc/platforms/4xx/yosemite.c:308

308              yosemite_set_emacdata();

(gdb)
The $T packet is a gdb Stop Reply packet. It is sent by the target to gdb when a breakpoint is encountered. In our example, the $T packet returned the value of the program counter and register r1.[92] The rest of the activity is the reverse of that in Listing 14-5. The PowerPC trap breakpoint instructions are removed, and gdb restores the original instructions to their respective memory locations.
- Файлы *.GDB изнутри
- TCP REMOTE BUFFER
- Complex protocols and connection tracking
- Binary Serialization
- Дополнительные сведения о gdb
- CHAPTER 15 Remote Access with SSH
- CHAPTER 20 Remote File Serving with FTP
- Logging In and Out from a Remote Computer
- Dynamic Host Configuration Protocol
- Understanding Point-to-Point Protocol over Ethernet
- Remote X
- Remote Registry Editor


