Книга: Microsoft Windows Embedded CE 6.0 Exam Preparation Kit
Target Control Commands
Target Control Commands
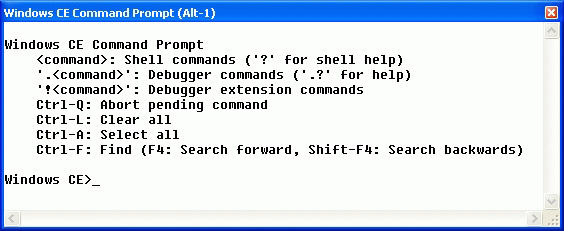
The Target Control service provides access to a command shell for the debugger to transfer files to the target device and debug applications. This target control shell, displayed in Figure 4-3, is accessible from within Visual Studio with Platform Builder via the Target Control option on the Target menu. However, it is important to keep in mind that the target control shell is only available if the Platform Builder instance is attached to a device through KITL.

Figure 4-3 The target control shell
Among other things, the target control shell enables you to perform the following debugging actions:
? Break into the Kernel Debugger (break command).
? Send a memory dump to the debug output (dd command) or to a file (df command).
? Analyze memory usage for the kernel (mi kernel command) or the entire system (mi full command).
? List processes (gi proc command), threads (gi thrd command), and thread priorities (tp command), as well as the modules loaded on the system (gi mod command).
? Launch processes (s command) and end processes (kp command).
? Dump the processes heap (hp command).
? Enable or disable the system profiler (prof command).
NOTE
Target control commands
For a complete list of target control commands, see the section "Target Control Debugging Commands" in the Windows Embedded CE 6.0 Documentation, available on the Microsoft MSDN® Web site at http://msdn2.microsoft.com/en-us/library/aa936032.aspx.
- Using general-purpose commands
- Using backup management commands
- Using recovery management commands
- Debugging and Target Device Control
- Introduction to Microprocessors and Microcontrollers
- Chapter 11. Iptables targets and jumps
- Appendix A. Detailed explanations of special commands
- Data sending and control session
- Commands
- ACCEPT target
- CLASSIFY target
- CLUSTERIP target


