Книга: Mastering VMware® Infrastructure3
Monitoring Host and Virtual Machine Network Usage
Monitoring Host and Virtual Machine Network Usage
VirtualCenter's graphs provide a wonderful tool for measuring a virtual machine's or a host's network usage.
Monitoring network usage requires a slightly different approach than monitoring CPU or memory. With either CPU or memory, reservations, limits, and shares can dictate how much of these two resources can be consumed by any one virtual machine. Network usage cannot be constrained by any of those mechanisms. Since virtual machines plug into a virtual machine port group, which is part of a vSwitch on a single host, how the virtual machine interacts with the vSwitch can be manipulated by the virtual switch's or port group's policy. For instance, if the administrator needs to restrict a virtual machine's overall network output, Traffic Shaping can be configured on the vSwitch, but more likely on the port group, to restrict the virtual machine to a specific amount of outbound bandwidth. There is no way to restrict virtual machine inbound bandwidth on the ESX Server.
Virtual Machine Isolation
Certain virtual machines may indeed need to be limited to a specific amount of outbound bandwidth. Servers such as FTP, file and print, web and proxy servers, or any server whose main function is to act as a file repository or connection broker may need to be limited or traffic shaped to an amount of bandwidth that allows it to meet its service target, but not to monopolize the host it runs on. Isolating any of these virtual machines to a vSwitch of its own is more likely a better solution, but requires it the appropriate hardware configuration.
You can measure a virtual machine's or a host's output or reception of network traffic using the graphs in VirtualCenter. The graphs can provide accurate information on the actual usage, or ample information that a particular virtual machine is monopolizing a virtual switch, especially using the Stacked Graph chart type. Figure 11.50 shows a virtual machine's network utilization.
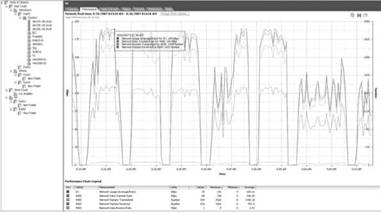
Figure 11.50 An example of a virtual machine's network usage.
Perform the following steps to create a real-time graph for a virtual machine's transmitted network usage:
1. Connect to the VirtualCenter server or an individual ESX Server host with the VI Client.
2. In the inventory tree, click on a virtual machine. This shows you the Summary tab. Click the Performance tab, shown in Figure 11.51.
3. Click the Change Chart Options link.
4. Under Chart Options, click on the Network bull's-eye or the + sign.
5. By selecting the Real-time option on the left, you can then choose which objects and counters on the right you want to monitor. In this example, let's say you want to monitor a virtual machine's outbound bandwidth. Select the 4000 counter and then select Network Data Transmit Rate and Network Packets Transmitted (see Figure 11.52). These two counters will give you a great window into how much network bandwidth this particular virtual machine is consuming in the outbound direction. Click OK.
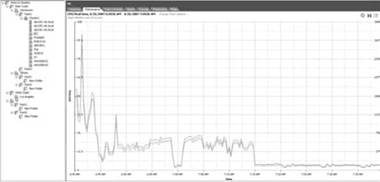
Figure 11.51 To begin customizing a Network graph, click the Performance tab.
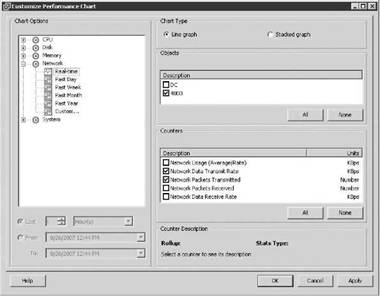
Figure 11.52 Changing the graph view to network-related information.
6. The Network Data Transmit Rate is in kilobytes/second and its unit of measurement is shown on the left as KBps. The Network Packets Transmitted represents the number of packets being transmitted. The unit of measurement is Number and appears on the right. By hovering your mouse over any data point in the graph, you can find out how much bandwidth is being consumed or how many packets are being transmitted, as shown in Figure 11.53.
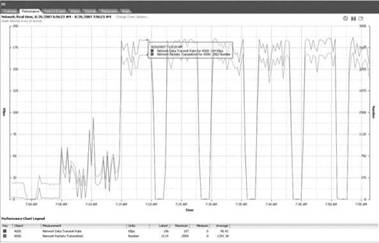
Figure 11.53 This graph shows real-time outbound network usage using the mouse pointer to show a specific data point.
When looking at historical network data usage for a virtual machine, there is only one object, the virtual machine, and one counter that can be used, Network Usage (Average/Rate). This counter will show average aggregated usage, both received and transmitted, in KBps (see Figures 11.54 and 11.55).
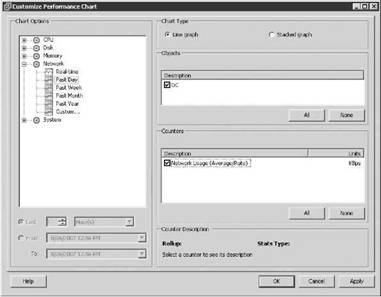
Figure 11.54 Choosing the chart option Past Day, the object virtual machine, and the counter Network Usage (Average/Rate).
Follow these steps to create a real-time graph for a host's transmitted network usage: 1. Connect to the VirtualCenter server or an individual ESX Server host with the VI Client.
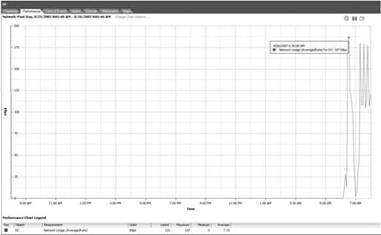
Figure 11.55 Graph showing this virtual machine's network usage for the past day.
2. In the inventory tree, click on an ESX host. This will show you the Summary tab in the Details section on the right. Select the Performance tab, shown in Figure 11.56.
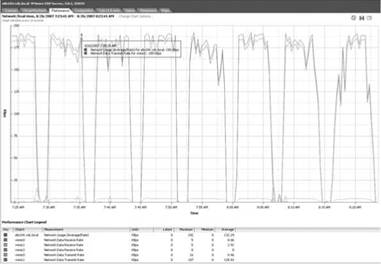
Figure 11.56 Changing to the Performance tab for a host.
3. Click the Change Chart Options link.
4. Under Chart Options, click on the Network bull's-eye or the + sign, shown in Figure 11.57.
5. By selecting the Real-time option on the left, you can then choose which objects and counters on the right you want to monitor. In this example, let's say you want to monitor a host's out bound bandwidth per vmnic. Select the vmnics objects and then select Network Data Transmit Rate and Network Packets Transmitted (see Figure 11.58). Click OK.
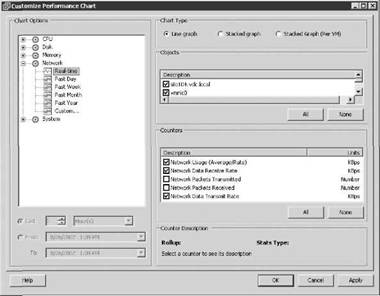
Figure 11.57 Setting up a graph to show a host's network usage.
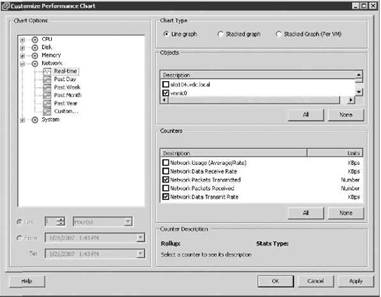
Figure 11.58 Choosing specific vmnics provides a way to see overall network traffic for a virtual switch or NIC team.
6. Very much like the earlier example for a virtual machine, these two counters will give you a window into how much network activity is occurring on this particular host in the outbound direction for each vmnic. This is especially relevant if you want to see different rates of usage for each physical network interface, which, by definition, represents different virtual switches or NIC teams. An example of network monitoring using the Performance tab is shown in Figure 11.59.
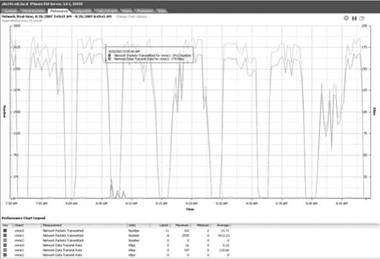
Figure 11.59 Graph displaying transmission data for all vmnics on the ESX host.
What if you wanted to see which virtual machine was producing the most network activity on an ESX host? Change the graph to display the virtual machines as objects by choosing the Stacked Graph (Per VM) chart type. This allows the administrator to select all or only those virtual machines to monitor for network activity. Be aware, though, that the only counter available with a stacked graph is Network Usage (Average/Usage). See Figures 11.60 and 11.61.
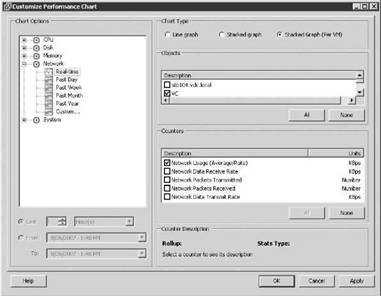
Figure 11.60 Choosing a Stacked Graph chart type allows you to make quick comparisons between the virtual machines running on an ESX host.
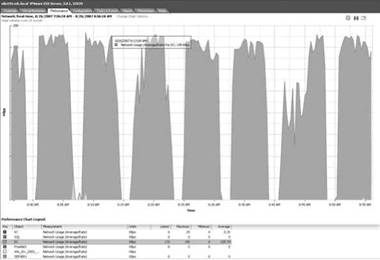
Figure 11.61 Here is a stacked graph comparing each virtual machine and showing aggregate usage of all virtual machines running on a specific ESX host. This graph emphasizes the DC virtual machine.
- Chapter 11 Monitoring Virtual Infrastructure Performance
- Разработка приложений баз данных InterBase на Borland Delphi
- Open Source Insight and Discussion
- Introduction to Microprocessors and Microcontrollers
- Chapter 6. Traversing of tables and chains
- Chapter 7. The state machine
- Chapter 8. Saving and restoring large rule-sets
- Chapter 11. Iptables targets and jumps
- Chapter 5 Installing and Configuring VirtualCenter 2.0
- Chapter 16. Commercial products based on Linux, iptables and netfilter
- Appendix A. Detailed explanations of special commands
- Appendix B. Common problems and questions


